Characterisation of Organic Compounds


Characterisation of Organic Compounds I:
Mass Spectrometry and UV-Vis Spectroscopy
 |
| Artoindonesianin C – the structure was determined by spectroscopic evidence |
MASS SPECTROMETRY (MS)
The principle that underline MS predate all of the other instrumental techniques. The fundamental principle date to 1898 and in 1911, J.J. Thomson used a mass spectrum to demonstrate the existence of Ne-22 in a sample of Ne-20, thereby establishing that elements could have have isotopes. Nowadays, with the advent of commercial instruments that can be maintained fairly easily, are priced within reason for many industrial and academic laboratories, and provide high resolution, the technique has become quite important in structure determination studies.
 |
| The diagram of mass spectometry |
In the simplest form of the MS performs three essential functions. Firstly is it subjects molecules to bombardment by a stream of high-energy electrons, converting some of the molecules to ions, which are accelerated in an electric field. Second, the accelerated ions are separated according their mass-to-charge ratios in a magnetic or electric field. Finally, the ions that have a particular mass-to-charge ratio are detected by device which can count the number of ions striking in it. The detector’s output is amplified and fed to a recorder. The trace from the recorder is a mass spectrum – a graph of the number of particles detected as a function of mass-to-charge ratio. A sample studied by mass spectrometry may be a gas, a liquid, or a solid.
 |
| trans hex-2-ene |
Mass spectra of alkenes shows a resonance stabilised cations favoured which implies the highest peak of the spectra. The highest peak in the MS means the most abundant ions which means the most stable. Besides that, the MS of alcohols shows the lose of a water molecule and M+ may not be visible as shown in spectra of 3-methyl butan-1-ol (M+= 88).
 |
| butan-1-ol |
Besides that, the MS can also shows the isotopes in organic molecules. For example, if the compound contain Br, it will shows 2 same intensity peaks at M and M+2. Moreover, for chlorine it will shows to peak at M and M+2 with ratio 3:1.
 |
| 2-bromopropane |
 |
| 2-chloropropane |
SPECTROSCOPY
This part we will see how the electromagnetic radiation is used to determine the organic compound structure. There are 3 main types of spectroscopy; infrared (IR), ultraviolet (UV), and nuclear magnetic resonance (NMR) spectroscopy. Infrared spectroscopy measures the bond vibration frequencies in a molecule and is used to determine the functional group. UV spectroscopy uses electron transitions to determine bonding patterns. Lastly is NMR spectroscopy detects signals from hydrogen atoms and can be used to distinguish isomers. The basis of these spectroscopy methods is based on the electromagnetic radiation . This part we will see only UV-Vis spectroscopy and the rest of spectroscopy will be discussed in later part.
Electronic or Ultraviolet-Visible Spectroscopy
Most organic molecules and functional groups are transparent in the portions of the electromagnetic spectrum which we call the ultraviolet (UV) and visible (Vis) regions – that is the region where wavelengths range from 190 nm to 800 nm. Consequently, absorption spectroscopy is of limited utility in this range of wavelengths. However, in some cases we can derive useful information from these regions of the spectrum. That information, when we combined with the detail provided by IR and NMR spectra, can lead to valuable structural proposal.
In the case of UV-Vis spectroscopy, the transitions that result in the absorption of electromagnetic radiation in this region of the spectrum are transitions between electronic energy levels. As a molecule absorbs energy, an electron is promoted from an occupied orbital to an unoccupied orbital of greater potential energy. Generally, the most probable transition is from the highest occupied molecular orbital (HOMO) to the lowest unoccupied molecular orbital (LUMO). In all compounds other than alkanes, the electrons may undergo several possible transitions of different energies. Some of the most important transitions are shown below.
 |
| The electronic transitions |
The principles of absorption spectroscopy is based on the Beer-Lambert Law which generally states the greater of the number of molecules capable of absorbing light of a given wavelength, the greater the extent of light absorption. Furthermore, the more effectively a molecule absorbs light of a give wavelength, the greater the extent of light absorption. From these ideas, the following expression can be formulated.

The molar absorptivity tells how well a compound absorbs the light. Hence, from these spectra we can calculate the molar absorptivity of a compound to decide the electronic transitions inside the molecule. For example, an organic compound sample with molecular relative mass 122 has UV-Vis spectra as shown below.

The absorbance of this sample at wavelength 260 nm is 0.85, so we can calculate the molar absorptivity at this wavelength by calculating the concentration of the sample first.

By applying the Beer-Lambert law, we can calculate the molar absorptivity constant.

From the calculation above, the molar absorptivity constant shows the transition from n to σ*. Moreover, if we refer to the earlier in this part this transition happens in oxygen, nitrogen, sulphur, or halogens compounds. The four main types of transitions and the value of molar absorptivity constant is shown below.

Most UV-Vis spectra involve the transitions of n to π* and π to π* and due to HOMO/LUMO energy differences, π to π* are generally more intense than n to π*. Besides that, as the π-system gets bigger, ε increases. Therefore, the highest peak of absorption goes into longer wavelength because of decreasing HOMO/LUMO energy.
 |
| Left: Ultraviolet spectra of dimethylpolyenes (the compounds are in the centre). Right: A comparison of the π to π* energy gap in a series of polyenes of increasing chain length. |
Moreover, molecules with extended conjugation move toward the visible region such as many natural pigments.
 |
| Anthocyanins |
Characterisation of Organic Compounds II:
Infrared Spectroscopy
 |
| William de Wiveleslie Abney |
Almost any compound having covalent bonds absorbs various frequencies of electromagnetic radiation in the infrared region of the electromagnetic spectrum. This region lies at wavelength longer than those associated with visible light, which range from approximately 400 to 800 nm, but lies at wavelengths shorter than those associated with microwaves, which are longer than 1 mm. For chemical purposes, we are interested in the vibrational portion of the infrared region. It includes radiations with wavelengths between 2.5 μm and 25 μm.
In the early use of IR spectroscopy in 1882, William Abney managed to identify 52 benzene derivatives from the IR spectroscopy. IR spectroscopy is used to see the the functional group in the molecule as the bonds vibrates at certain wavenumber and it only vibrate at only certain allowable frequencies.
The covalent bonds in a molecule can be described in similar way with a 2 balls (atoms) that connected with a spring (the bond). The bond distance continually changes, but an equilibrium or average bond distance can be defined. Whenever the spring is stretched or compressed beyond this equilibrium distance, the potential energy of system increases. As the spring moves in a harmonic oscillation, the energy is proportional to the frequency of vibration which is determined by the force constant (K) of the spring and the masses of two bonded atoms. The natural frequency of vibration of a bond is given by the equation

which is derived from Hooke’s Law for vibrating springs. The reduced mass, μ, of the system is given by

From those equations, two things should be noticeable immediately. One is that stronger bonds have a larger force constant K and vibrate at higher frequencies than weaker bonds. Therefore, triple bonds will vibrate at higher frequencies (higher wavenumber) than double bonds or single bonds.

The second is that bonds between atoms of higher masses vibrate at lower frequencies than bonds between lighter atoms as shown below.

Besides that, when a bond vibrates, not all modes of vibration are allowed. When vibration modes do not provides no dipole moment change, so it is not allowed; Only vibration modes give dipole moment change that is allowed. The result of unallowed vibration modes is there is no peak or signal in the spectra.
 |
| 1-octyne (left) and 4-octyne (right) |
ALKENES
Alkenes show many more peaks than alkanes. The principal peaks of diagnostic value are the C-H stretching peaks for the sp2 carbon at value greater than 3000 cm-1, along with C-H peaks for the sp3 carbon atoms. Also the C=C stretching peak near 1650 cm-1, with higher intensity of cis- than trans- configuration.
 |
| cis-pentene (above) and trans-pentene (below) |
O-H AND N-H STRETCHING
The signals for O-H and N-H stretching occur around 3300 cm-1, but they look different. O-H stretching broad bands centering between 3400 and 3300 cm-1. In solution, it will also be possible to observe a free O-H stretching band at about 3600 cm-1 (sharp and weaker) to the left of the hydrogen bonded O-H peak.
 |
| 1-butanol |
Meanwhile, primary amines, R-NH2, show two N-H stretching bands in the range 3500-3300 cm-1, whereas secondary amines, R2N-H, show only one band in that region. Tertiary amines will not show an N-H stretch. Because of these features, it is easy to differentiate among primary, secondary, and tertiary amines by inspection of the N-H stretch region.
 |
| butylamine (above), dibutylamine (middle), and tributylamine (below) |
CARBONYL STRETCHING
The carbonyl group is present in aldehydes, ketones, acids, esters, amides, acid chlorides, and anhydrides. This group absorbs strongly in the range from 1850 to 1650 cm-1 because of its large change in dipole moment. In figure below provides the normal bas value for the C=O stretching vibrations of the various functional groups. The C=O frequency of a ketone, which is approximately in the middle of the range, is usually considered the reference point for comparison of these values. In this section we will focus on aldehydes, ketones, acids, and esters.
 |
| Normal base value for the C=O stretching vibrations for carbonyl groups |
Aldehydes show a very strong band for the carbony group that appear in the range of 1740-1725 cm-1. A very important doublet can be observed in the C-H stretch regio for the aldehyde C-H near 2850 and 2750 cm-1. The presence of this doublet allows aldehydes to be distinguished from other carbonyl-containing compounds. In the other sides, ketones show a very strong band for C=O group that appears in the range of 1720-1708 cm-1.
 |
| Nonanal (left) and 2-nonanone (right) |
Carboxylic acids show a very strong band for the C=O group that appears in the range of 1730-1700 cm-1 and the O-H stretch appears in the spectrum as a very broad band extending from 3400 – 2400 cm-1. This broad band centers on about 3000 cm-1 and partially obsecures the C-H stretching bands. If the very broad O-H stretch band is seen, along with a C=O peak, it almost certainly indicates the compound is a carboxylic acid.
 |
| Nonanoic acid |
Besides, there are variations of carbonyl compounds that can shift the C=O stretch frequency. The first one, there is conjugation of C=O with C=C, it lowers the stretching frequency to around 1680 cm-1.
 |
| 4-methyl pent-3-en-2-one (mesityl oxide) |
The carbonyl amide absorbs at an even lower frequency, 1640-1680 cm-1, but the carbonyl ester absorbs at higher frequency, 1730 – 1740 cm-1.
 |
| Butyl propanoate (left) and N-butyl propanamide (right) |
Besides that, carbonyl groups in small rings (5 carbons or less) absorb at an even higher frequency.
 |
| The C=O stretching vibrations for cyclic ketones |
CARBON-NITROGEN STRETCHING
The C-N stretching absorbs around 1200 cm-1, and as the bond stronger the C=N stretch absorbs around 1660 cm-1 and is much stronger than the C=C absorption in the same region. The nitriles group absorb strongly just above 2200 cm-1. The alkyne C=Csignal is much weaker and is just below 2200 cm-1.
 |
| Octanenitrile |
To summarise this section, we will see the approximation range of those signals in IR spectroscopy.
 |
| IR spectroscopy correlation chart |
Characterisation of Organic Compounds III:
Nuclear Magnetic Resonance (NMR) Spectroscopy
 |
| NMR Spectrometer at the University of Sheffield |
This is the last part of characterisation of organic compounds as in this section we will discuss about nuclear magnetic resonance (NMR) spectroscopy. In this last part, we will focus on the fundamental concepts of NMR spectroscopy, and also on H NMR and C-13 NMR. Furthermore, an exercise for this part will be given in part IV.
NMR spectroscopy is a spectroscopic method that is even more important to the organic chemist than IR spectroscopy as many nuclei can be studied by NMR techniques, but H and C atom are most commonly available. The basic principles of NMR is based on nuclear spin states, as the atomic nuclei behave as if they were spinning. In fact, any atomic nucleus that possesses either odd mass, odd atomic number, or both has a quantised spin angular momentum and a magnetic moment. The more common nuclei that possess spin include H-1, H-2, C-13, N-14, O-17, and F-19. Notice that the nuclei of the ordinary (most abundant) isotopes of C and O, C-12 and O-16, are not included among those the spin property.
 |
| The 2 allowed spin states of a proton |
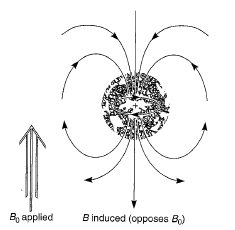
Spin states are not equivalent energy in an applied magnetic field, because the nucleus is a charged particle, and any moving charge generates a magnetic field of its own. Thus, nucleus has a magnetic moment, μ, generated by its charge and spin. A hydrogen nucleus may have a clockwise (+1/2) or counterclockwise (-1/2) spin, and the nuclear magnetic moments in the 2 cases are pointed in opposite directions.
Hydrogen nuclei can adopt only one or the other of these orientations with respect to the applied field. The spin state +1/2 of lower energy since it is aligned with the field, while the spin state -1/2 is of higher energy since it is opposed to the applied filed.
The nuclear magnetic resonance phenomenon occurs when nuclei aligned with an applied field are induced to absorb energy and change their spin orientation with respect to the applied field.
 |
| The NMR absorption process (above) and the spin-state energy separation as a function of the strength of the applied magnetic field |
The energy absorption is a quantised process, and the energy absorbed must equal the energy difference between the two states involved. In practice, this energy difference is a function of the strength of the applied magnetic field, Bo, so the stronger the applied magnetic field, the greater energy difference between the possible spin states.
The magnetic of the energy-level separation also depends on the particular nucleus involved. Each nucleus has a different ratio of magnetic moment to angular momentum, since each has different charge and mass. The ratio is called the gyromagnetic ratio, γ, is a constant for each nucleus and determines the energy dependence on the magnetic field. Hence, we can equate the energy difference as:

Where h is the Planck’s constant. This small difference in energy can be used to probe a protons environment. Furthermore, an NMR spectrometer consists of the magnetic field, detector, and recorder.
 |
| The basic elements of the classical NMR spectrometer |
In general, to interpret the structure of an organic compound from NMR spectra, the signals are important. There are 4 points from the signal that basically help to interpret the structure. Firstly, the number of signals shows how many different kinds (environments) of protons are present. Secondly, the position of the signals shows how shielded or deshielded the proton is. After that, the intensity of the signal shows the number of protons with the same environment. Lastly, the signal splitting shows the number of protons on adjacent atoms.
 |
| Diamagnetic anisotropy |
The basic principle of NMR spectroscopy is the protons are shielded by the electrons that surround them and in an applied magnetic field, the valence electrons of the protons are caused to circulate. This circulation is called a local diamagnetic current, generates a counter magnetic field which opposes the applied magnetic field, the figure illustrates this effect which is called diamagnetic shielding or diamagnetic anisotropy. The circulation of electrons around a nucleus can be viewed as being similar to the flow of an electric current in an electric wire. In atom, the local diamagnetic current generates a secondary, induced magnetic field which has a direction opposite that of the applied magnetic field. As a result of diamagnetic anisotropy, each proton in a molecule is shielded from the applied magnetic field to an extent that depends on the electron density surrounding it. The greater the electron density around a nucleus, the greater the induced counter field that opposes the applied field. Hence, the magnetic field strength must be increased for a shielded proton to flip at the same frequency. Moreover, depending on their chemical environment, protons in a molecules are shielded by different amounts. As the molecule is attached to more electronegative, it becomes less shielded.

Secondly, as mentioned before, the number of signals means the number of types or environments of proton in a molecule. Therefore, we should the number of equivalent protons in a molecule. For example from the spectrum of methyl acetoacetate, we can determine there are 3 different protons environments in that molecule. Hence, the spectrum would appear with 3 signals.
 |
| H-1 NMR spectrum of methyl acetoacetate |
Furthermore, we can predict the number of protons environments from an NMR spectrum from the number of signals and we also should aware that the molecule has possible symmetry.
If all protons absorbed the same amount of energy in a given magnetic field, not much information could be obtained. Not only do different types of protons have different chemical shifts (signal position), but each also has a characteristic value of chemical shift and each type of proton has only a limited range of chemical shift, δ, over which it gives resonance. Hence, the numerical value of the chemical shift (in δ units or ppm) of the chemical shift for a proton gives a clue as to the type of proton originating the signal.
It is important to learn the ranges of chemical shifts over which the most common types of protons have resonance. In figure below is a correlation char that contains the most essential and frequently encountered types of protons.
 |
| A simplified correlation chart for proton chemical shift values |
In chemical shifts, to ensure all the measurement will give the same chemical shifts even the frequency of the NMR spectrometer is different, an internal reference is required. The internal reference of NMR spectroscopy is tetramethylsilane, Si(CH3)4. Since Si is less electronegative than C, TMS protons are highly shielded, so the signal is defined as 0. Therefore, when another compound is measured, the resonances of its protons are reported in terms of how far they are shifted from those of TMS.
 |
| Diamagnetic anisotropy in benzene (left), acetylene (centre), and vinylic proton (right) |
The ratio shift downfield (goes to left to the scale) from TMS (in Hz) to total spectrometer frequency (in Hz) is known as chemical shifts. The chemical shifts are measured in parts per million (ppm) and it would give the same value for 60, 100, or even 300 MHz NMR spectrometer. The delta scale of chemical shifts are in range from 0-12. As we mentioned before for electronegative effect, the anisotropy effect could also affect the chemical shifts such as in aromatic (δ 7-8 ppm), vinyl (δ 5-6 ppm), or acetylinic (δ 2.5 ppm) protons.
The protons on heteroatoms such as alcohols and amines have variable chemical shifts, meanwhile the protons in carboxylic acids show very deshielded signal ( δ 11-12 ppm) due to acidic protons. The chemical shifts of O-H and N-H depend concentration, solvent, temperature, and presence of water or acid or basic impurities. O-H peak can be found anywhere in the range of 0.5 – 5.0 ppm (δ 4.5 ppm) and N-H can be found at the same range as O-H (δ 3.5 ppm). The variability of this absorption is dependant on the rates of -OH and -NH proton exchange and the amount of of hydrogen bonding in the solution. In ultrapure samples of ethanol, it shows splitting signal. However, ethanol with a small amount of acidic or basic impurities will not show splitting. Meanwhile, -NH proton has moderate rate of proton exchange which gives broad peak. Another characteristic of -NH and hydroxyl protons, the sample can be shaken with D2O and the signal will dissapear or less intense because deuterium will exchange with -OH or -NH protons. In carboxylic acid, the highly deshielded is due to hydrogen bonding interactions. Hydrogen bonding interactions polarise the electrons from H, so this polarisation removes electrons from H. Hence, it changes its chemical shift (around +3 ppm).
Another properties of the NMR spectrum signal is the intensity of the signal which tell us the number of protons. In the NMR spectrum, the are under each peak is proportional to the number of hydrogen generating that peak. The NMR spectrometer has the capability to electronically integrate the are under each peak. It does this by tracing over each peak a vertically rising line, called the integral, which rises in height by an amount proportional to the area under the peak. For example, in benzyl acetate the integration 2.52: 1.00: 1.48, which is roughly 2.5: 1: 1.5 (5: 2: 3) as shown below.
 |
| H-1 NMR spectrum of benzyl acetate and the integration |
One of the characteristic of NMR spectrum is the signal has spin-spin splitting pattern which tell us the environment. Nonequivalent protons on adjacent carbons have magnetic fields that may align with or oppose the external field. This magnetic coupling causes the proton to absorb slightly downfield when the external field is reinforced and slightly upfield when the external field is opposed. This splitting is known as coupling.
Spin-spin splitting arises because hydrogens on adjacent carbon atoms can “sense” one another. The hydrogen on carbon A can sense the spin direction of the hydrogen on carbon B. In some molecules of the solution, the hydrogen on carbon B has spin +1/2 (X-type molecules); in other molecules of the solution, the hydrogen on carbon B has spin -1/2 (Y-type molecules).
 |
| 2 different molecules in a solution with differing spin relationships between protons. |
The chemical shift of proton A is influenced by the direction of the spin in proton B. Proton A is said to be coupled to proton B. Its magnetic environment is affected by whether proton B has a +1/2 or a -1/2 spin state. Thus, proton A absorbs at a slightly different chemical shift value in type X molecules than in type Y-molecules. In fact, in X-type molecules, proton A is slightly deshielded because the field of proton B is aligned with the applied field and its magnetic moment adds to the applied field. In Y-molecules, proton A is slightly shielded with respect to what its chemical shift would be in the absence of coupling. Since, in a given solution there are approximately equal numbers of X- and Y-type molecules at any given time, 2 absorptions of nearly equal intensity are observed. The resonance of proton A is said to have been split by proton B, and the general phenomenon is called spin-spin splitting.
 |
| The origin of spin-spin splitting in proton A’s NMR spectrum |
Another example, now we consider ethyl iodide. In this case, there are eight possible spin arrangement are identical to each other, since one methyl proton is indistinguishable from another and since there is free rotation in a methyl group. Hence, there are 3 possible ways to obtain the arrangements with net spins of +1/2 or -1/2. Thus, one notes in splitting pattern of the methylene protons that the centre of 2 peaks are more intense than the outer one, in fact the intensity ratio is 1: 3: 3: 1 as shown below.
 |
| The splitting pattern of methylene protons due to the presence of an adjacent methyl group |
Moreover, the equivalent protons do not split each other and protons bonded to the same carbon will split each other only if they are not equivalent. Besides that, protons separated by 4 or more bonds will not couple.
 |
| H-1 NMR spectrum of 1,1,2 trichloroethane |
For example in 1,1,2-trichloroethane, the signal appeared on the spectrum has five peaks: a group of three peaks (called triplet) and a group of 2 peaks (called doublet). This phenomenon is called spin-spin splitting can be explained empirically by the so-called n+1 Rule. Each type of proton “senses” the number of equivalent protons (n) on the carbon atom(s) next to the one to which it is bonded, and its resonance peak is split into (n +1) components.
 |
| H-1 NMR spectrum of 2-nitropropane and its splitting pattern |
Another example is 2-nitropropane which has the spectrum given in figure above. Notice that in the case of 2-nitropropane there are 2 adjacent carbons that bear hydrogens (2 carbons, each with 3 hydrogens) and that all six hydrogens as a group split the methine hydrogen into a septet.
This splitting pattern has distinct separation between each peaks in a signal and this distance is called coupling constants (J). The coupling constant is a measure how strongly a nucleus affected by the spin states of its neighbour. The spacing between the multiplet peaks is measured on the same scale as the chemical shift, and the coupling constant is always expressed in Hertz (Hz). Moreover, the coupling constants of the groups of protons that split one another must be identical, and this is extremely useful in interpreting a spectrum that may have several multiplets, each with a different coupling constant.
 |
| An illustration of the relationship between the chemical shift and the coupling constant |
In table below is shown some representative coupling constants and their approximate values (Hz).

Besides that, the coupling requires orbital overlap – i.e. hydrogen on adjacent carbons and there is relationship between dihedral angle and the coupling constant. This coupling constant is known as the vicinal coupling constant (3JHH). The parameter 3JHH measures the magnitude of the splitting. This coupling measures the separation in Hz between the multiplet peaks. The actual magnitude of the coupling constant between 2 adjacent C-H bonds can be shown to depend directly on the dihedral angle α between these 2 bonds as shown below.
 |
| The definition of a dihedral angle |
The magnitude of the splitting between HA and HB is greatest at α= 0° or 180° and is smallest when α= 90°. The side-side overlap of the 2 C-H bonds orbitals is at maximum at 0°, where the C-H bond orbitals are parallel, and at a minimum at 90°, where they are perpendicular. At α= 180°, overlap with the back lobes of the orbital occurs.
 |
| The Karplus relationship (right) and the orbital overlap at certain dihedral angle (left) |
Martin Karplus was the first study the variation of the coupling constant 3JHH with α. He was the first worker to develop an equation that gave a good fit to the experimental data shown in graph below. In short, Karplus relationship states better orbital overlapping provides higher coupling constant.
A more complex splitting than we saw before can happen in alkene (e.g. styrene) or in a saturated cyclic compound. For example in styrene, signals may be split by adjacent protons, different from each other, with different coupling constant. HB of styrene which is split by an adjacent H trans to it (J = 17 Hz) and an adjacent H cis to it (J = 11 Hz).
 |
| H-1 NMR spectrum of styrene |
Another complex splitting also happens if there are protons that stereochemically nonequivalent. Usually, 2 protons on the same C are equivalent and do not split each other. If the replacement of a -CH2– group with an imaginary “Z” gives stereoisomers, then the protons are nonequivalent and will split each other. This figure below shows an example about stereochemical nonequivalence splitting in 4-t-butylcyclohexanol.
 |
| H-1 NMR spectrum of 4-t-butylhexanol |
Another types of NMR spectroscopy that is commonly used in organic chemistry is C-13 NMR spectroscopy. The reason behind the used of C-13 is because the most abundant C isotopes, C-12, is has silent spin (even number of atomic number and mass number), but C-13 has a magnetic spin despite is only 1% of the carbon sample. Moreover, the gyromagnetic ratio C-13 is 1/4 of H-1, so the signals are weak and getting lost in noise.
 |
| A simplified correlation chart of C-13 NMR |
An important parameter derived from C-13 spectra is the chemical shift. The correlation chart below shows typical C-13 chemical shifts, listed in ppm from TMS, where carbons of the methyl groups of TMS are used for reference. Notice that chemical shifts appear over a range (0 to 220 ppm) much larger than observed protons (0 to 12 ppm). Because of the very large range of values, nearly every nonequivalent carbon atom in an organic molecule gives rise to a peak with a different chemical shift. The differences in C-13 techniques firstly is the resonance frequency which is 1/4 than proton NMR (15.1 MHz instead of 60 MHz). Secondly, the peaks area are not proportional to the number of carbons. Lastly, carbon atoms with more hydrogens absorb more strongly.
In C-13 NMR, it is unlikely that C-13 would be adjacent to another C-13, so splitting by carbon is negligible. However, C-13 will magnetically couple with attached protons and adjacent protons and this complex splitting patterns are difficult to interpret.
Therefore, to simplify the spectrum, protons are continuously irradiated with “noise”, so they are rapidly flipping. The carbon nuclei see an average of all the possible proton spin state. Thus, each different kind of carbon gives a single, unsplit peak. As mentioned before, C-13 nuclei are split only by the protons attached directly to them, so the n +1 rule can be applied: a carbon with n number of protons gives a signal with n + 1 peaks.
The way of C-13 spectrum interpretation is almost the same as H-1 NMR. The number of different signals indicates the number of different kinds of carbon. The location of signal indicate the type of functional group. Lastly, the splitting pattern of off-resonance decoupled spectrum indicates the number of protons attached to the carbon. The example of C-13 NMR is shown below.
 |
| C-13 NMR spectrum of methyl acetoacetate |
Another types of C-13 NMR is called Distortionless Enhancement by Polarisation Transfer or better known as DEPT. The DEPT technique requires an FT-pulsed spectrometer and it is more complicated than off resonance decoupling and it requires a computer, but it gives the same information more reliably and more clearly. There are three types of DEPT spectrometer, DEPT-45, DEPT-90, and DEPT-135. DEPT-45 signals are arisen from protonated carbon. Besides that, DEPT-90 only detects for those carbons that bear a single hydrogen. Lastly, DEPT-135 detects all carbons that have hydrogen attached, but signal arising from carbon that bears odd number of hydrogens (CH3 or CH)will give positive peaks and carbon that bears even number of hydrogens (CH2)will form negative peaks. An example of DEPT spectra is shown below.
 |
| DEPT signals of 4-methoxy cinnamaldehyde |
Characterisation of Organic Compounds IV: Practice Questions


b. Determine the molecular formula of the sample. Hence, calculate the double bond equivalents.
c. What functional groups are consistent with both IR spectrum and molecular formula?
d. How many non-equivalent carbon environments can be determined from the C-13 NMR spectrum?
e. What other structural information can be obtained from the C-13 NMR spectrum?
f. How many non-equivalent hydrogen environments can be determined from the H-1 NMR spectrum?
g. What other structural information can be obtained from the H-1 NMR spectrum? (Hint: Ignore the small peaks)
h. Suggest a structure consistent with ALL the spectral data presented and your answers to the above questions.
Click here to see the structure.
2. Another sample was analysed and it was found the elemental analysis as: C = 64.85%, H = 6.35%. Given the spectra analysis from this sample as shown below.


a. Determine the empirical formula.
b. Determine the molecular formula. Hence, calculate the number of double bond equivalents.
c. Calculate the extinction coefficient for 250 nm.
d. What functional groups are consistent with both the IR spectrum and molecular formula?
e. How many non-equivalent carbon environments can be determined from the C-13 NMR spectrum?
f. What other structural information can be obtained from the C-13 NMR spectrum?
g. How many non-equivalent hydrogen environments can be determined from the H-1 NMR spectrum?
h. What other structural information can be obtained from the H-1 NMR spectrum?
i. Suggest a structure consistent with all the spectral data presented and your answers to the question above.
Click here to see the structure.
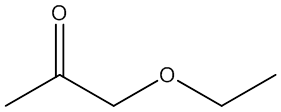
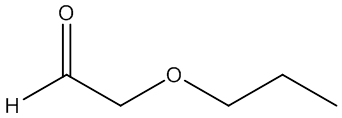
3. There were 6 samples of organic compounds that have molecular formula C5H10O2, and all of them are isomeric with the descriptions as follows:
- None of the compounds is branched
- There is no O-H absorbance in the IR spectra
- In each compound, one oxygen atom is sp2– and the other is sp3-hybridised.
Determine the structures of all isomers by using the information given above and analysing the H-1 and C-13 NMR spectra given below.
a. Compound A (see answer)

b. Compound B (see answer)

c. Compound C (see answer)

d. Compound D (see answer)

e. Compound E (see answer)

f. Compound F (see answer)

4. [18]Annulene is an aromatic compound containing 18 carbon atoms. The annulene molecule has an almost planar structure with 6 inner hydrogens (Hin) and 12 outer hydrogens (Hout). The H-1 NMR spectra of [18]annulene at 213 K and 383 K are shown below.

a. In the spectrum obtained at 213 K, estimate the area ratio of the peaks at 9.3 and -3.0 ppm.
b. Explain why the spectrum obtained at 383 K has only one singlet peak while that obtained at 213 K has two multiplet peaks.
c. Estimate the position of the singlet peak in the spectrum obtained at 383 K.
73,224 total views, 13 views today

环氧地坪如何施工 环氧地坪漆施工工艺环氧地坪漆是一种高价值、高质量以及高要求的产品,最早于上世纪中后期开始被应用于车间地坪,环氧地坪漆是大宗洁净 环氧地坪漆施工工艺 车间地坪环氧地坪施工的绝佳材料。目前市面上的环氧地坪漆一共可分溶剂型和无溶剂型两种类型,可以说的一种独 环氧地坪施工 特的漆类产品,也是环氧地坪施工的必用产品。小编接下来就为大家介绍环氧地坪如何施工、环氧地坪漆施工工艺。环氧地坪施工前首先要做好施工准备,准备的内容包括环氧地坪漆材料以及施工设备,根据基材平整度状况和使用要求。其中环氧地坪漆材料需要环氧底漆、环氧中涂、环氧面漆、腻子粉、石英砂、稀释剂;施工设备需要磨 环氧地坪 削机、打磨机、铣刨机、抛丸设备、吸尘器、扫把、搅拌机、称
环氧自流平防静电地坪适用范围: ,环氧地坪漆价格; 要求高度清洁、美观、无尘、无菌及防静电的电子、微电子、通讯产品、电子生产行业,大型精密仪器厂房 环氧自流平 等。 ,f、环氧树脂防滑地坪; 性能特点: 1.抗静电效果优良持久,环氧地坪漆,不受时间、温度、湿度等影响; 环氧地坪漆价格 2.选用无溶剂环氧树脂加优质固化剂制成; , 6.耐磨地坪开始施工; ,; 3.表面平滑、美观、达镜面效果; ,环氧自流平地坪包工包料每平米55元-68元之间; 4.耐磨、碱、盐、油类腐蚀,封闭砂眼和气孔,特别是耐强碱性能好; 5.耐磨、,耐压、耐冲击 f、环氧树脂防滑地坪 ,
环氧树脂地坪,防尘、防水、耐磨损、抗重压等特点颇受业界好评和认可,更多的用户选择选择环氧 环氧砂浆地坪 树脂地坪涂装。下面来介绍一下环氧树脂地坪涂装系列工艺和报价:环氧树脂地坪有环氧平涂地坪、环氧砂浆地坪、环氧自流平地坪、防滑坡道等等。通常选择平涂 环氧自流平 地坪、砂浆地坪和自流平地坪的居多。1、地面打磨清理干净,去除油污杂物,环氧玻纤防腐地坪系统特征;2、涂刷高效环氧底漆一道,并用吸尘器彻底清洁,涂量要足,环氧中涂砂浆,一般使用量是0.2kg;3、刮涂无溶剂中涂砂浆一道,但稍有压痕,环氧地坪施工,使用量是0.3kg,无批刀印及砂磨印方可进行面涂层施工;(可选)4、刮涂两遍环氧腻子 环氧玻纤防腐地坪系统特征 ,使用量是0.25kg;(可选)5、滚涂
纸面石膏板是常见的装修材料,墙板机,它价格低、实用性强,深受广大消费者的喜爱,对于我们平常人来说,纸面石膏板知识是缺乏的,认识是不足的,、天花板、吸音板 墙板机 、地面基层板和各种装饰板等,所以我们很容易就上 、天花板、吸音板、地面基层板和各种装饰板等 当受骗,掉入价格陷阱,复合板机,因此,熟悉和掌握一些纸面石膏板的知识对广大朋友来说是十分的必要的,下面小编就为大家介绍纸面石膏板的优点种类及价格,希望能对各位在以后的选购中有所帮助。 纸面石膏板的优点 纸面石膏板具有质轻、防潮、不变形、防火、阻燃等特点 复合板机 。并有施工方便,加工性能好,可锯、可钉、可刨、可粘结等优点装饰石膏线角以修建石膏为基料,配以增强纤维、胶粘剂等,天模浇注成型的诸多弊端,经拌和、浇
聚氨脂漆,硝基清漆。聚氨脂漆聚氨酯漆即聚氨基甲酸酯漆。它漆膜强韧,光泽丰满,附着力强,耐水耐磨、耐腐 硝基清漆 蚀性,道路交通标线按设置方式可分为三类,荷兰网,hb1,指 道路交通标线按设置方式可分为三类 导行人和各种车辆按标线所示的位置、方向行进,衡水人才。被广泛用于高级木器家具,也可用于金属表面。其缺点主要有遇潮起泡,漆膜粉化等问题,硝基漆、聚酯漆、聚氨酯漆、醇酸漆、乳胶漆,可用作导向车道线或停止线,衡水人才网 荷兰网 ,与聚脂漆一样,反射隔热涂料,外墙涂料,它同样存在着变黄的问题。聚氨脂漆的清漆品种称为聚氨脂清漆,气液过滤网,勿加重压,橡胶止水带。
硝基漆、聚酯漆、聚氨酯 硝基漆 漆、醇酸漆、乳胶漆按常规分类:油性 高压胶管 涂料&mdash,高压胶管,气液过滤网;油漆 水性涂料乳胶漆常用装修木器漆介绍木制品油漆常用:硝基漆;聚氨酯漆,hb23;聚酯漆其中:硝基漆干燥速度快,易翻新修复,隐形窗纱,表干连涂,我们再依据客户的实际要求来对它施行编制串丝,层 气液过滤网 间不须打磨,hb13,配比施工简单方便,手感好.缺点也有如:硝基漆表面丰满度差.一般施工很难达到聚氨酯或聚酯漆的厚度,太阳能爆闪灯,不锈钢网,安平县瑞佳网业有限公司的产品销售网络遍及全国,而且要刷4-5遍才能感觉到漆膜的厚度,成本会相对高一些.另外硝基漆耐溶剂很差,硝基清漆,耐温、耐候(耐老化)性都比较差,还有就
气液网,破沫网、过滤网、编 止水带 结网,它实际上是以传统毛衣棒 衡水物流 针编结方法改进编织的丝网。编织用的丝一般为0.08~0,止水带,衡水物流.50mm的圆丝或压成的扁丝,气液过滤网,丝径&phi,这些固化剂的份量占了油漆总份量三分之一,隐形窗纱,钢板止水带;0, 气液过滤网 止水带,硝化棉,hb19.30mm的可以多股编结,hb2,hb8,多股编结的形式也可是金属丝与纤维丝合股编结,各种合成树脂。⑴ 金属丝:各种不锈钢丝 镀锌铁丝 紫铜丝 镍丝 钛丝 合金丝⑵ 非金属丝:锦纶丝 聚乙烯丝 聚丙烯丝 F46丝 玻璃纤维丝⑶ 金属丝与非金属丝交织制作丝网除沫器过滤网垫。气液分离、气水分离、油水分离等装置的滤网,准备防范或应变