Quinine
 |
|
Molecular Formula: C20H24N2O2
Molecular Weight: 324.417
| IUPAC Name: |
6′-Methoxycinchonan-9-ol |
CAS Number: 56-54-2
PubChem: 1065
NMRShiftDB: 10016314
Spectrometer: Bruker AV 400 MHz
Probe: 1mm MicroProbe
Solvent: CDCl3
Sample Concentration: ca. 200 µg
|
Quinine (US /ˈkwaɪnaɪn/, UK /ˈkwɪniːn/ or /kwɪˈniːn/ kwin-een) is a natural white crystalline alkaloid having antipyretic (fever-reducing),antimalarial, analgesic (painkilling), and anti-inflammatory properties and a bitter taste. It is a stereoisomer of quinidine, which, unlike quinine, is an antiarrhythmic. Quinine contains two major fused-ring systems: the aromatic quinoline and the bicyclic quinuclidine.
Quinine occurs naturally in the bark of the cinchona tree, though it has also been synthesized in the laboratory. The medicinal properties of the cinchona tree were originally discovered by the Quechua, who are indigenous to Peru and Bolivia; later, the Jesuitswere the first to bring cinchona to Europe.
Quinine was the first effective Western treatment for malaria caused by Plasmodium falciparum, appearing in therapeutics in the 17th century. It is pre-dated as a malarial treatment by the Chinese herbalist’s use of Artemisia annua, described in a 4th-century text, a plant from which the antimalarial drug artemisinin was derived. It remained the antimalarial drug of choice until the 1940s, when other drugs such as chloroquine that have fewer unpleasant side effects replaced it. Since then, many effective antimalarials have been introduced, although quinine is still used to treat the disease in certain critical circumstances, such as severe malaria, and in impoverished regions due to its low cost. Quinine is available with a prescription in the United States and “over-the-counter” (in minute quantities) in tonic water. Quinine is also used to treat lupus and arthritis. Quinine was also frequently prescribed in the US as an off-label treatment for nocturnal leg cramps, but this has become less prevalent due to a Food and Drug Administration statement warning against the practice.[2]
Quinine is highly fluorescent (quantum yield ~0.58) in 0.1 M sulfuric acid solution and it is widely used as a standard for fluorescence quantum yield measurement.[3][4] It is on the World Health Organization’s List of Essential Medicines, a list of the most important medications needed in a basic health system.[5]
1D Proton Spectrum:


Medical uses
As of 2006, quinine is no longer recommended by the WHO (World Health Organization), as first-line treatment for malaria, and should be used only when artemisinins are not available.[6][7][8][9]
Quinine is a basic amine and is usually presented as a salt. Various existing preparations include the hydrochloride, dihydrochloride,sulfate, bisulfate and gluconate. This makes quinine dosing complicated, since each of the salts has a different weight.
The following amounts of each salt form contain equal amounts of quinine:
- quinine base 100 mg
- quinine bisulfate 169 mg
- quinine dihydrochloride 122 mg
- quinine hydrochloride 111 mg
- quinine sulfate (actually (quinine)2H2SO4∙2H2O) 121 mg
- quinine gluconate 160 mg
All quinine salts may be given orally or intravenously (IV); quinine gluconate may also be given intramuscularly (IM) or rectally (PR).[10][11] The main problem with the rectal route is the dose can be expelled before it is completely absorbed; in practice, this is corrected by giving a half dose again.
In the United States, quinine sulfate is commercially available in 324-mg tablets under the brand name Qualaquin; the adult dose is two tablets every eight hours. No injectable preparation of quinine is licensed in the US; quinidine is used instead.[12][13]
13C NMR

Top 10 FindIt Molecular Structures Consistent With Molecular Formula and Proton Resonances:
The correct structure is at position 7.
 Best 10 structures in decreasing rating (structure ID shown in parentheses):
    1: 0.957622 (  102439)    2: 0.957340 ( 3499717)    3: 0.955644 (   65753)
    4: 0.955078 (  847715)    5: 0.953062 ( 6336167)    6: 0.953047 (  585971)
    7: 0.952892 (    1065)    8: 0.950814 (    8547)    9: 0.949068 (  934598)
   10: 0.948731 ( 2037943)
.gif)
2D Multiplicity-Edited HSQC Spectrum:
Determined HSQC Correlations:
Top 10 FindIt Molecular Structures Consistent With Proton and Protonated Carbon (HSQC) Resonances:
The correct structure is at position 1.
 Best 10 structures in decreasing rating (structure ID shown in parentheses):
    1: 0.937466 (    1065)    2: 0.915501 ( 6336167)    3: 0.900599 ( 3499717)
    4: 0.897815 (  183259)    5: 0.895740 ( 3083557)    6: 0.894629 (  101764)
    7: 0.894536 (   84495)    8: 0.891677 ( 4835740)    9: 0.890939 ( 3809868)
   10: 0.889296 ( 5191849)

|
Automated VerifyIt Proton Assignments:

|
|
Automated VerifyIt Carbon Assignments:

|
2D COSY

2D DQF-COSY Spectrum:
AssembleIt HSQC & DQF-COSY Derived Carbon-Carbon Correlations:
2D N15_HMBC Spectrum:
AssembleIt HSQC & N15_HMBC Derived Nitrogen-Carbon Correlations:
2D HMBC Spectrum:
AssembleIt HSQC, HMBC, DQF-COSY & N15_HMBC Derived Correlations:
AssembleIt Derived Structure With NMRgraph Added Likely Oxygen Atoms:
 |
|
Most likely structure (out of 277 possible ones) by agreement with carbon chemical shift prediction |
Comments:
Quinine is used as an antimalaria drug.
Before performing a full structure elucidation, consider running FindIt. Only the molecular formula, proton, and/or (potentially only protonated) carbon shift information are needed.
At natural abundance, a 1D carbon spectrum is 5,700 times less sensitive to acquire than a 1D proton spectrum. Acquiring the shown HSQC and HMBC spectra instead is still faster than acquiring one 1D carbon spectrum. The full quinine structure elucidation is demonstrated using about 200 micro grams of sample. Only the shown NMR data from a room-temperature 1 mm capillary probe are used. No molecular formula (MF) or information from other spectroscopic methods are needed.

History
Quinine[34] is an effective muscle relaxant, long used by the Quechua, who are indigenous to Peru, to halt shivering due to low temperatures. The Peruvians would mix the ground bark of cinchona trees with sweetened water to offset the bark’s bitter taste, thus producing tonic water.

19th-century illustration of Cinchona calisaya
Quinine has been used in unextracted form by Europeans since at least the early 17th century. It was first used to treat malaria in Rome in 1631. During the 17th century, malaria was endemic to the swamps and marshes surrounding the city of Rome. Malaria was responsible for the deaths of severalpopes, many cardinals and countless common Roman citizens. Most of the priests trained in Rome had seen malaria victims and were familiar with theshivering brought on by the febrile phase of the disease. The Jesuit brother Agostino Salumbrino (1561–1642), an apothecary by training who lived inLima, observed the Quechua using the bark of the cinchona tree for that purpose. While its effect in treating malaria (and hence malaria-induced shivering) was unrelated to its effect in controlling shivering from rigors, it was still a successful medicine for malaria. At the first opportunity, Salumbrino sent a small quantity to Rome to test as a malaria treatment. In the years that followed, cinchona bark, known as Jesuit’s bark or Peruvian bark, became one of the most valuable commodities shipped from Peru to Europe. When King Charles II was cured of malaria at the end of the 17th Century with quinine, it became popular in London.[35] It remained the antimalarial drug of choice until the 1940s, when other drugs took over.[36]
The form of quinine most effective in treating malaria was found by Charles Marie de La Condamine in 1737.[37][38] Quinine was isolated and named in 1820 by French researchers Pierre Joseph Pelletier and Joseph Bienaimé Caventou.[39] The name was derived from the original Quechua (Inca) word for the cinchona tree bark, quina or quina-quina, which means “bark of bark” or “holy bark”. Prior to 1820, the bark was first dried, ground to a fine powder, and then mixed into a liquid (commonly wine) which was then drunk. Large-scale use of quinine as a prophylaxis started around 1850.
Quinine also played a significant role in the colonization of Africa by Europeans. Quinine had been said to be the prime reason Africa ceased to be known as the “white man’s grave”. A historian has stated, “it was quinine’s efficacy that gave colonists fresh opportunities to swarm into the Gold Coast, Nigeria and other parts of west Africa”.[40]
To maintain their monopoly on cinchona bark, Peru and surrounding countries began outlawing the export of cinchona seeds and saplings beginning in the early 19th century. The Dutch government persisted in its attempt to smuggle the seeds, and by the 1930s Dutch plantations in Java were producing 22 million pounds of cinchona bark, or 97% of the world’s quinine production.[40] During World War II, Allied powers were cut off from their supply of quinine when the Germans conquered the Netherlands and the Japanese controlled the Philippines and Indonesia. The United States had managed to obtain four million cinchona seeds from the Philippines and began operating cinchona plantations inCosta Rica. Nonetheless, such supplies came too late; tens of thousands of US troops in Africa and the South Pacific died due to the lack of quinine.[40] Despite controlling the supply, the Japanese did not make effective use of quinine, and thousands of Japanese troops in the southwest Pacific died as a result.[41][42][43][44]
Synthetic quinine
Cinchona trees remain the only economically practical source of quinine. However, under wartime pressure, research towards its synthetic production was undertaken. A formal chemical synthesis was accomplished in 1944 by American chemists R.B. Woodward and W.E. Doering.[45] Since then, several more efficient quinine total syntheses have been achieved,[46] but none of them can compete in economic terms with isolation of the alkaloid from natural sources. The first synthetic organic dye, mauveine, was discovered by William Henry Perkin in 1856 while he was attempting to synthesize quinine.
References
- “Qualaquin (quinine) dosing, indications, interactions, adverse effects, and more”.Medscape Reference. WebMD. Retrieved 29 January 2014.
- “FDA Drug Safety Communication: New risk management plan and patient Medication Guide for Qualaquin (quinine sulfate)”. Food and Drug Administration. 2010-08-07. Retrieved 2011-02-21.
- Joseph R. Lakowicz. Principles of Fluorescence Spectroscopy 3rd edition. Springer(2006). ISBN 978-0387-31278-1. Chapter 2. page 54.
- Quinine sulfate ogi.edu. Retrieved 16 August 2013
- “WHO Model List of Essential Medicines” (PDF). World Health Organization. October 2013. Retrieved 22 April 2014.
- World Health Organization (2006). “Guidelines for the treatment of malaria”. World Health Organization. Retrieved 10 August 2009.
- Dorndorp A, Nosten F, Stepniewska K, et al. (2005). “Artesunate verus quinine for treatment of severe falciparum malaria: a randomised trial”. Lancet 366 (9487): 717–25.doi:10.1016/S0140-6736(05)67176-0. PMID 16125588.
- Reyburn, H; Mtove, G; Hendriksen, I; Von Seidlein, L (2009). “Oral quinine for the treatment of uncomplicated malaria”. Brit J Med 339: b2066. doi:10.1136/bmj.b2066.PMID 19622550.
- Achan J, Tibenderana JK, Kyabayinze D, et al. (2009). “Effectiveness of quinine versus artemether-lumefantrine for treating uncomplicated falciparum malaria in Ugandan children: randomised trial”. Brit Med J 338: b2763. doi:10.1136/bmj.b2763.
- Barennes H, et al. (1996). “Efficacy and pharmacokinetics of a new intrarectal quinine formulation in children with Plasmodium falciparum malaria”. Brit J Clin Pharmacol 41 (5): 389. doi:10.1046/j.1365-2125.1996.03246.x.
- Barennes, H.; Balima-Koussoubé, T; Nagot, N; Charpentier, JC; Pussard, E (2006).“Safety and efficacy of rectal compared with intramuscular quinine for the early treatment of moderately severe malaria in children: randomised clinical trial”. Brit Med J 332(7549): 1055–57. doi:10.1136/bmj.332.7549.1055. PMC 1458599. PMID 16675812.
- Center for Disease Control (1991). “Treatment with Quinidine Gluconate of Persons with Severe Plasmodium falciparum Infection: Discontinuation of Parenteral Quinine”. Morb Mort Weekly Rep 40 (RR–4): 21–23. Retrieved 2006-05-06.
- Magill, A; Panosian, C (2005). “Making Antimalarial Agents Available in the United States”. New Engl J Med 353 (4): 335–337. doi:10.1056/NEJMp058167.PMID 16000347.
- Jamaludin A, Mohamad M, Navaratnam V, et al. (1988). “Relative bioavailability of the hydrochloride, sulphate and ethyl carbonate salts of quinine”. Br J Clin Pharmacol 25 (2): 261–3. doi:10.1111/j.1365-2125.1988.tb03299.x. PMC 1386482. PMID 3358888.
- Optically active isomers of quinine and quinidine and their respective biological actionAccessed 26/1/2009
- Sanders, L. “Poison Pill”, The New York Times Magazine, 4/13/2008.
- http://dailymed.nlm.nih.gov/dailymed/drugInfo.cfm?id=8546
- Dannenberg AL; Behal, FJ; Johnson, J; Johnson, Jamie (1983). “Use of quinine for self-induced abortion”. The Southern Medical Journal 76 (7): 846–849. doi:10.1097/00007611-198307000-00007. PMID 6867792.
- Yeka A, Achan J, D’Alessandro U, Talisuna AO (2009). “Quinine monotherapy for treating uncomplicated malaria in the era of artemisinin-based combination therapy: an appropriate public health policy?”. Lancet Infect Dis 9 (7): 448–452. doi:10.1016/S1473-3099(09)70109-4. PMID 19555904.
- “NPS warns on quinine”. Auspharm e News, 6 January 2010.
- ^ Jump up to:a b Roche, R. J.; Silamut, K.; Pukrittayakamee, S.; Looareesuwan, S.; Molunto, P.; Boonamrung, S.; White, N. J. (1990). “Quinine induces reversible high-tone hearing loss”.British Journal of Clinical Pharmacology 29 (6): 780. doi:10.1111/j.1365-2125.1990.tb03704.x. edit
- Paintaud, G.; Alván, G.; Berninger, E.; Gustafsson, L. L.; Idrizbegovic, E.; Karlsson, K. K.; Wakelkamp, M. (1994). “The concentration-effect relationship of quinine-induced hearing impairment”. Clinical Pharmacology and Therapeutics 55 (3): 317–23.doi:10.1038/clpt.1994.32. PMID 8143397. edit
- Tange, R. A.; Dreschler, W. A.; Claessen, F. A. P.; Perenboom, R. M. (1997). “Ototoxic reactions of quinine in healthy persons and patients with Plasmodium falciparum infection”.Auris Nasus Larynx 24 (2): 131. doi:10.1016/S0385-8146(96)00031-4. edit
- Department of Clinical Pharmacology, Huddinge University Hospital, Sweden (1994). “The concentration-effect relationship of quinine-induced hearing impairment”. Clin Pharmacol Ther 55 (3): 317–323. doi:10.1038/clpt.1994.32. PMID 8143397.
- “FDA Orders Stop to Marketing Of Quinine for Night Leg Cramps”. FDA Consumer Magazine. Food and Drug Administration. July–August 1995. Archived from the originalon 2008-01-15. Retrieved 2009-07-31.
- “FDA Orders Unapproved Quinine Drugs from the Market and Cautions Consumers About Off-Label Use of Quinine to Treat Leg Cramps”. United States Food and Drug Administration. 2006-12-11. Retrieved 2009-07-31.
- “Malaria Surveillance – United States, 2004”. Center for Disease Control. 2006-11-22. Retrieved 2009-11-22.
- Ballestero, JA; Plazas, PV; Kracun, S; Gómez-Casati, ME; Taranda, J; Rothlin, CV; Katz, E; Millar, NS et al. (2005). “Effects of Quinine, Quinidine, and Chloroquine on α9α10 Nicotinic Cholinergic Receptors”. Molecular Pharmacology 68 (3): 822–829.doi:10.1124/mol.105.014431. PMID 15955868.
- Charming, Cheryl (2006). Miss Charming’s Guide for Hip Bartenders and Wayout Wannabes. USA: Sourcebooks, Inc. p. 189. ISBN 978-1-4022-0804-1.
- “Basic Concepts in Fluorescence”.
- Hobhouse, Henry (2004). Šest rostlin, které změnily svět (in Czech). Prague: Akademie věd České republiky. p. 59. ISBN 80-200-1179-X.
- Microgram Bulletin, Volume 42, Number 10, October 2009, Page 79. Retrieved 22 September 2012.
- Porritt, M., Cryptocaryon irritans, Reef Culture Magazine, 1. Retrieved 9th Jul 2009
- History of quinine: Friedrich A. Flückiger and Daniel Hanbury, Pharmacographia: A history of the principal drugs of vegetable origin, met with in Great Britain and British India(London, England: Macmillan and Co., 1874), pages 302-331: Cortex Cinchonæ.
- Rocco, Fiametta (2004). Quinine: malaria and the quest for a cure that changed the world. New York, NY: Perennial.
- Loren, Humphrey (2000). Quinine and Quarantine.
- de la Condamine (1738) “Sur l’arbre du quinquina” (On the quinquina tree) Histoire de l’Académie royale des Sciences, pages 226-243.
- See also: Joseph de Jussieu, Description de l’arbre à quinquina: mémoire inédit de Joseph de Jussieu (1737) (Description of the quinquina tree: unpublished memoir of Joseph de Jussieu (1737)). De Jussieu accompanied de la Condamine on the latter’s expedition to Peru.
- Pelletier and Caventou (1820) “Suite: Des recherches chimiques sur les quinquinas”(Continuation: Chemical research on quinquinas), Annales de Chimie et de Physique, vol. 15, pages 337-365. The authors name quinine on page 348: “…, nous avons cru devoir la nommer quinine, pour la distinguer de la cinchonine par un nom qui indique également son origine.” (…, we thought that we should name it “quinine” in order to distinguish it from cinchonine by means of a name that also indicates its origin.)
- Conner, Clifford D. (2005). A People’s History of Science: Miners, Midwives, and ‘Low Mechanicks’. New York: Nation Books. pp. 95–96. ISBN 1-56025-748-2. Also citesPorter, Roy (1998). The Greatest Benefit to Mankind: A Medical History of Humanity. New York: W. W. Norton. pp. 465–466. ISBN 0-393-04634-6.
- Louis Morton (1953). “29”. The Fall of the Philippines. Washington, D.C.: United States Army. p. 524.
- Alan Hawk. “Remembering the war in New Guinea: Japanese Medical Corps — malaria”.
- Lt. Gen. Leonard D. Heaton, ed. (1963). “8”. Preventive Medicine in World War II: Volume VI, Communicable Diseases: Malaria. Washington, D.C.: Department of the Army. pp. 401 and 434.
- “Notes on Japanese Medical Services”. Tactical and Technical Trends (U.S. War Department) (36). 1943.
- Woodward R, Doering W (1944). “The Total Synthesis of Quinine”. J Am Chem Soc 66(849).
- Kaufman, Teodoro S.; Rúveda, Edmundo A. (2005). “Die Jagd auf Chinin: Etappenerfolge und Gesamtsiege”. Angewandte Chemie, Int. Ed. (in German) 117 (6): 876–907. doi:10.1002/ange.200400663.
Further reading
- Schroeder-Lein, Glenna (2008). The encyclopedia of Civil War medicine. Armonk, N.Y. : M.E.: Sharpe, Inc.
- Hobhouse, Henry. Seeds of Change Six Plants that Transformed Mankind. 2005. ISBN 1-59376-049-3.
- Stockwell, J. R. (1982). “Aeromedical considerations of malaria prophylaxis with mefloquine hydrochloride”. Aviation, Space, and Environmental Medicine 3 (10): 1011–3.
- Wolff RS, Wirtschafter D, Adkinson C (June 1997). “Ocular quinine toxicity treated with hyperbaric oxygen”. Undersea Hyperb Med 24 (2): 131–4. PMID 9171472. Retrieved 2008-08-13.
- Slater, Leo (2009). War and disease : biomedical research on malaria in the twentieth century. New Brunswick, N.J: Rutgers University Press.
- The Lords of Industry, Modern History Sourcebook: Henry Demarest Lloyd: North American Review 331 (June 1884)
External links
In total synthesis, the Quinine total synthesis describes the efforts in synthesis of quinine over a 150 year period. The development of synthetic quinine is considered a milestone in organic chemistry although it has never been produced industrially as a substitute for natural occurring quinine. The subject has also been attended with some controversy: in 2001 Gilbert Stork published the first stereoselective quinine synthesis and he shed doubt (calling it a myth) on the earlier claim in 1944 by Bob Woodward and William Doering on account that they had obtained not quinine but a precursor molecule. In 2001, an editorial in Chemical & Engineering Newssupported Storks claim but according to a critical 30 page review in this matter published in 2007 in Angewandte Chemie the Woodward/Doering claim is valid.

Chemical structure
The aromatic component of the quinine molecule is a quinoline with a methoxy substituent. The amine component has a quinuclidine skeleton and the methylene bridge in between the two components has a hydroxyl group. The substituent at the carbon-3 position is a vinyl group. The molecule is optically active with five stereogenic centers (the N1 and C4 constituting a single asymmetric unit), making synthesis potentially difficult because it is one of 16 stereoisomers.
Quinine total synthesis timeline

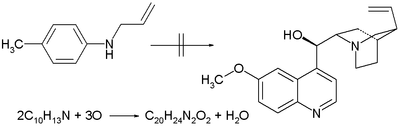
- 1856: William Henry Perkin attempts quinine synthesis by oxidation of N-allyl toluidine based on the erroneous idea that 2 equivalents of this compound with chemical formulaC10H13N plus three equivalents of oxygen yield one equivalent of C20H24N2O2 (quinine’s chemical formula) and one equivalent of water [2] His oxidations with other toluidines sets him on the path of mauveine which eventually leads to the birth of chemical industry.
- 1907: the correct atom connectivity established by Paul Rabe [3]
- 1918: Paul Rabe and Karl Kindler synthesize quinine from quinotoxine,[4] reversing the Pasteur chemistry. The lack of experimental details in this publication would become a major issue in the Stork/Woodward controversy almost a century later.

- The first step in this sequence is sodium hypobromite addition to quinotoxine to an N-bromo intermediate possibly with structure 2. The second step is organic oxidation withsodium ethoxide in ethanol. Because of the basic conditions the initial product quininone interconverts with quinidinone via a common enol intermediate and mutarotation is observed. In the third step the ketone group is reduced with aluminum powder and sodium ethoxide in ethanol and quinine can be identified. Quinotoxine is the first relay molecule in the Woodward/Doering claim.

- 1939: Rabe and Kindler re investigate a sample left over from their 1918 experiments and identify and isolate quinine (again) together with diastereomers quinidine, epi-quinine and epi-quinidine [5]
- 1940: Robert Burns Woodward signs on as a consultant for the Polaroid Corporation at the request of Edwin H. Land. Quinine is of interest to Polaroid for its light polarizingproperties.
- 1943: Prelog and Proštenik interconvert an allyl piperidine called homomeroquinene and quinotoxine.[6] Homomeroquinene (the second relay molecule in the Woodward/Doering claim) is obtained in several steps from the biomolecule cinchonine (related to quinidine but without the methoxy group):

- The key step in the assembly of quinotoxine is a claisen condensation:
- 1944: Bob Woodward and W.E. Doering report the synthesis of quinine [7] starting from 7-hydroxyisoquinoline. Although the title of their 1 page publication is The total synthesis of quinine it is oddly not the synthesis of quinine but that of the precursor homomeroquinene (racemic) and then with groundwork already provided by Prelog a year earlier to quinotoxine (enantiopure after chiral resolution) that is described.

- Woodward and Doering argue that Rabe in 1918 already proved that this compound will eventually give quinine but do not repeat Rabe’s work. In this project 27-year-old assistant-professor Woodward is the theorist and post doc Doering (age 26) the bench worker. According to William, Bob was able to boil water but an egg would be a challenge. As many natural quinine resources are tied up in the enemy-held Dutch East Indies synthetic quinine is a promising alternative for fighting malaria on the battlefield and both men become instant war heroes making headlines in the New York Times, Newsweek and Life magazine.
- 1944: The then 22 year old Gilbert Stork writes to Woodward asking him if he did repeat Rabe’s work.
- 1945: Woodward and Doering publish their second lengthy Quinine paper.[8] One of the two referees rejects the manuscript (too much historic material, too much experimental details and poor literary style with inclusion of words like adumbrated and apposite) but it is published without changes nonetheless.
- 1974: Kondo & Mori synthesize racemic vinylic gamma-lactones, a key starting material in Stork’s 2001 quinine synthesis.:[9]

- The starting materials are trans-2-butene-1,4-diol and ethyl orthoacetate and the key step is a Claisen rearrangement

- In this process the racemic lactone reacts in aminolysis with (S)-methylbenzylamine assisted by triethylaluminum to a diastereomeric pair of amides which can be separated by column chromatography. The S-enantiomer is converted back to the S-lactone in two steps by hydrolysis with potassium hydroxide and ethylene glycol followed by azeotropic ring closure.
- 2001: Gilbert Stork publishes his stereoselective quinine synthesis.[11] He questions the validity of the Woodward/Doering claim: “the basis of their characterization of Rabe’s claim as “established” is unclear”. The Chemical & Engineering News is equally critical.[12]
- 2007: Researcher Jeffrey I Seeman in a 30 page review [13] concludes that the Woodward–Doering/ Rabe–Kindler total synthesis of quinine is a valid achievement. He notes that Paul Rabe was an extremely experienced alkaloid chemist, that he had ample opportunity to compare his quinine reaction product with authentic samples and that the described 1918 chemistry was repeated by Rabe although not with quinotoxine itself but still with closely related derivatives.
- 2008: Smith and Williams revisit and confirm Rabe’s d-quinotoxine to quinine route [14]
Stork quinine total synthesis
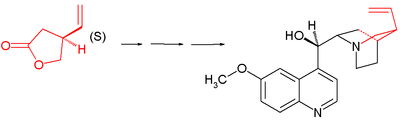
The Stork quinine synthesis starts from chiral (S)-4-vinylbutyrolactone 1. The compound is obtained by chiral resolution and in fact, in the subsequent steps all stereogenic centers are put in place by chiral induction: the sequence does not contain asymmetric steps.
 |
|
 |
| Stork quinine synthesis |
|
Introducing C8 and nitrogen |
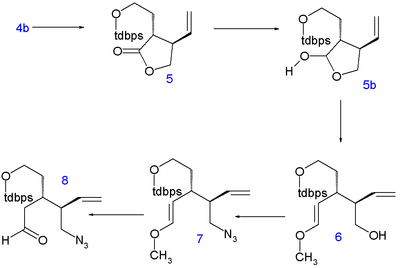
The lactone is ring-opened with diethylamine to amide 2 and its hydroxyl group is protected as a tert-butyldimethyl (TBS) silyl ether in 3. The C5 and C6 atoms are added as tert-butyldiphenylsilyl (TBDPS) protected iodoethanol in a nucleophilic substitution of acidic C4 with LDA at -78°C to 4 with correct stereochemistry. Removal of the silyl protecting group with p-toluenesulfonic acid to alcohol 4b and ring-closure by azeotropic distillation returns the compound to lactone 5 (direct alkylation of 1 met with undisclosed problems).
The lactone is then reduced to the lactol 5b with diisobutylaluminum hydride and its liberated aldehyde reacts in a Wittig reaction with methoxymethylenetriphenylphosphine(delivering the C8 atom) to form enol ether 6. The hydroxyl group is replaced in a Mitsunobu reaction by an azide group with diphenylphosphoryl azide in 7 and acid hydrolysis yields the azido aldehyde 8.
 |
|
 |
| First ring closure |
|
Second ring closure |
The methyl group in 6-methoxy-4-methylquinoline 9 is sufficiently acidic for nucleophilic addition of its anion (by reaction with LDA) to the aldehyde group in 8 to form 10 as a mixture of epimers. This is of no consequence for stereocontrol because in the next step the alcohol is oxidized in a Swern oxidation to ketone 11. A Staudinger reaction withtriphenylphosphine closes the ring between the ketone and the azide to the tetrahydropyridine 12. The imine group in this compound is reduced to the amine 13 with sodium borohydride with the correct stereospecificity. The silyl protecting group is removed with hydrogen fluoride to alcohol 14 and then activated as an mesyl leaving group by reaction with mesyl chloride in pyridine which enables the third ring closure to 15. In the final step the C9 hydroxyl group was introduced by oxidation with sodium hydride, dmso and oxygen with quinine to epiquinine ratio of 14:1.
Woodward / Doering formal quinine total synthesis
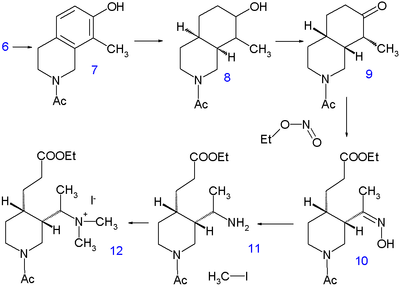
The 1944 Woodward / Doering synthesis starts from 7-hydroxyisoquinoline 3 for the quinuclidine skeleton which is somewhat counter intuitive because one goes from a stable heterocyclic aromat to a completely saturated bicyclic ring. This compound (already known since 1895) is prepared in two steps.
 |
|
 |
| Woodward/Doering quinine synthesis part I |
|
Part II |
The first reaction step is condensation reaction of 3-hydroxybenzaldehyde 1 with (formally) the diacetal of aminoacetaldehyde to the imine 2 and the second reaction step is cyclization in concentrated sulfuric acid. Isoquinoline 3 is then alkylated in another condensation by formaldehyde and piperidine and the product is isolated as the sodium salt of4.
 |
|
| Woodward/Doering quinine synthesis part III |
|
Hydrogenation at 220°C for 10 hours in methanol with sodium methoxide liberates the piperidine group and leaving the methyl group in 5 with already all carbon and nitrogen atoms accounted for. A second hydrogenationtakes place with Adams catalyst in acetic acid to tetrahydroisoquinoline 6. Further hydrogenation does not take place until the amino group is acylated with acetic anhydride in methanol but by then 7 is again hydrogenated with Raney nickel in ethanol at 150°C under high pressure to decahydroisoquinoline 8. The mixture of cis and trans isomers is then oxidized by chromic acid in acetic acid to the ketone 9. Only the cis isomer crystallizes and used in the next reaction step, a ring opening with the alkyl nitrite ethyl nitrite with sodium ethoxide in ethanol to10 with a newly formed carboxylic ester group and an oxime group. The oxime group is hydrogenated to theamine 11 with platinum in acetic acid and alkylation with iodomethane gives the quaternary ammonium salt 12and subsequently the betaine 13 after reaction with silver oxide.
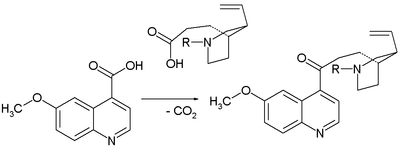
Quinine’s vinyl group is then constructed by Hofmann elimination with sodium hydroxide in water at 140°C. This process is accompanied by hydrolysis of both the ester and the amide group but it is not the free amine that is isolated but the urea 14 by reaction with potassium cyanate. In the next step the carboxylic acid group isesterified with ethanol and the urea group replaced with a benzoyl group. The final step is a claisen condensation of 15 with ethyl quininate 16, which after acidic workup yields racemic quinotoxine 17. The desired enantiomer is obtained by chiral resolution with the chiral dibenzoyl ester of Tartaric acid. The conversion of this compound to quinine is based on the Rabe/Kindler chemistry discussed in the timelime.
External links
References
- Pasteur, L. Compt. rend. 1853, 37, 110.
- Perkin, W. H. J. Chem. Soc. 1896, 69, 596
- Rabe, P.; Ackerman, E.; Schneider, W. Ber. 1907, 40, 3655
- Rabe, P.; Kindler, K. Chem. Ber. 1918, 51, 466
- P. Rabe, K. Kindler, Ber. Dtsch. Chem. Ges. B 1939, 72, 263–264.
- Proštenik, M.; Prelog, V. HelV. Chim. Acta 1943, 26, 1965.
- The Total Synthesis of Quinine R. B. Woodward and W. E. Doering J. Am. Chem. Soc.; 1944; 66(5) pp 849 – 849; doi:10.1021/ja01233a516
- The Total Synthesis of Quinine R. B. Woodward and W. E. Doering J. Am. Chem. Soc.; 1945; 67(5) pp 860 – 874; doi:10.1021/ja01221a051
- SYNTHESIS OF γ-LACTONES BY THE CONDENSATION OF 2-ALKENE-1,4-DIOLS WITH ORTHOCARBOXYLIC ESTERS Kiyosi Kondo and Fumio Mori Chemistry Letters Vol.3 (1974) , No.7 pp.741-742 doi:10.1246/cl.1974.741
- Synthesis and Absolute Configuration of the Acetalic Lignan (+)-Phrymarolin Fumito Ishibashi and Eiji Taniguchi Bulletin of the Chemical Society of Japan Vol.61 (1988) , No.12 pp.4361-4366 doi:10.1246/bcsj.61.4361
- The First Stereoselective Total Synthesis of Quinine Gilbert Stork, Deqiang Niu, A. Fujimoto, Emil R. Koft, James M. Balkovec, James R. Tata, and Gregory R. Dake J. Am. Chem. Soc.;2001; 123(14) pp 3239 – 3242; (Article) doi:10.1021/ja004325r.
- M. Jacobs, Chemical & Engineering News 2001, 79 (May 7), 5.
- Review: The Woodward-Doering/Rabe-Kindler Total Synthesis of Quinine: Setting the Record Straight Jeffrey I. Seeman Angew. Chem. Int. Ed. 2007, 46, 1378–1413doi:10.1002/anie.200601551 PMID 17294412
- Communication Rabe Rest in Peace: Confirmation of the Rabe-Kindler Conversion of d-Quinotoxine to Quinine: Experimental Affirmation of the Woodward-Doering Formal Total Synthesis of Quinine Aaron C. Smith, Robert M. Williams Angewandte Chemie International Edition 2008, 47, 1736–1740 doi:10.1002/anie.200705421


 DRUG APPROVALS BY DR ANTHONY MELVIN CRASTO