The intensity of the signal is proportional to the number of hydrogens that make the signal. Sometimes, NMR machines display signal intensity as an automatic display above the regular spectrum. (The exact number of hydrogens giving rise to each signal is sometimes also explicitly written above each peak, making our job a lot easier.) The intensity of the signal allows us to conclude that the more hydrogens there are in the same chemical environment, the more intense the signal will be.
Introduction
We can get the following information from a 1H Nuclear Magnetic Resonance (NMR) structure:
- The number of signals gives the number of non-equivalent hydrogens
- Chemical shifts show differences in the hydrogens’ chemical environments
- Splitting presents the number of neighboring hydrogens (N+1 rule)
- Integration gives the relative number of hydrogens present at each signal

The integrated intensity of a signal in a 1H NMR spectrum (does not apply to 13C NMR) gives a ratio for the number of hydrogens that give rise to the signal, thereby helping calculate the total number of hydrogens present in a sample.NMR machines can be used to measure signal intensity, a plot of which is sometimes automatically displayed above the regular spectrum. To show these integrations, a recorder pen marks a vertical line with a length that is proportional to the integrated area under a signal (sometimes referred to as a peak)– a value that is proportional to the number of hydrogens that are accountable for the signal. The pen then moves horizontally until another signal is reached, at which point, another vertical marking is made. We can manually measure the lengths by which the horizontal line is displaced at each peak to attain a ratio of hydrogens from the various signals. We can use this technique to figure out the hydrogen ratio when the number of hydrogens responsible for each signal is not written directly above the peak (look in the links section for an animation on how to manually find the ratio of hydrogens as described here).


Now that we’ve seen how the signal intensity is directly proportionate to the number of hydrogens that give rise to that signal, it makes sense to conclude that the more hydrogens of one kind there are in a molecule (equivalent hydrogens, so in the same chemical environment), the more intense the corresponding NMR signal will be. Here’s above a model that may help clear up some of the uncertainties.


Problems
1.) True or False? The number of hydrogens determines the intensity of a signal.
ans…………False. The relative number of hydrogens determines the intensity of a signal. The signal given by the three hydrogens in CH3CH2CHCl2 will not have the same intensity as the three hydrogens in ClCH2OCH3.
2.) Give the number of signals, the chemical shift value for each signal, and the number of integrating hydrogens for CH3OCH2CH2OCH3
answer There are 2 signals. One is at 3.3 ppm (6 hydrogens); the other at 3.5 ppm (4 hydrogens).
3
4.) 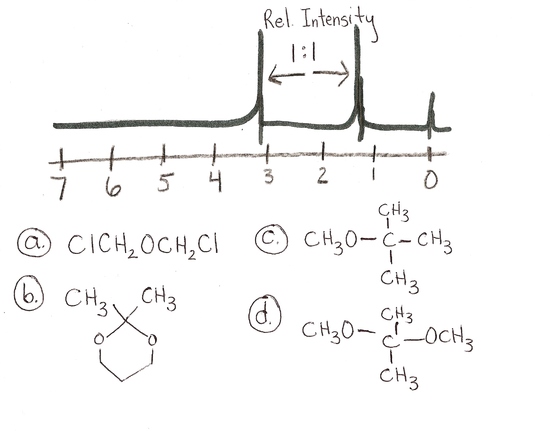 answer is a and d
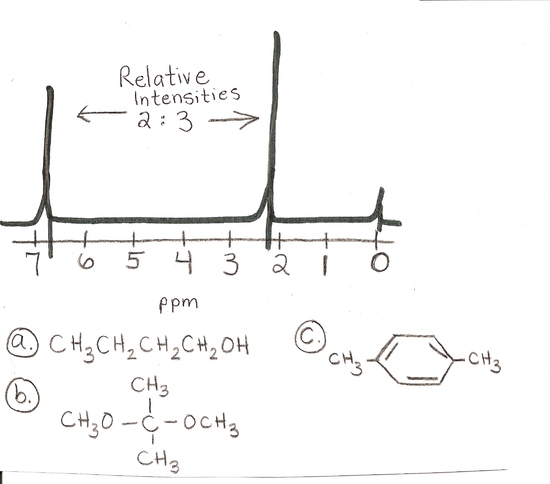
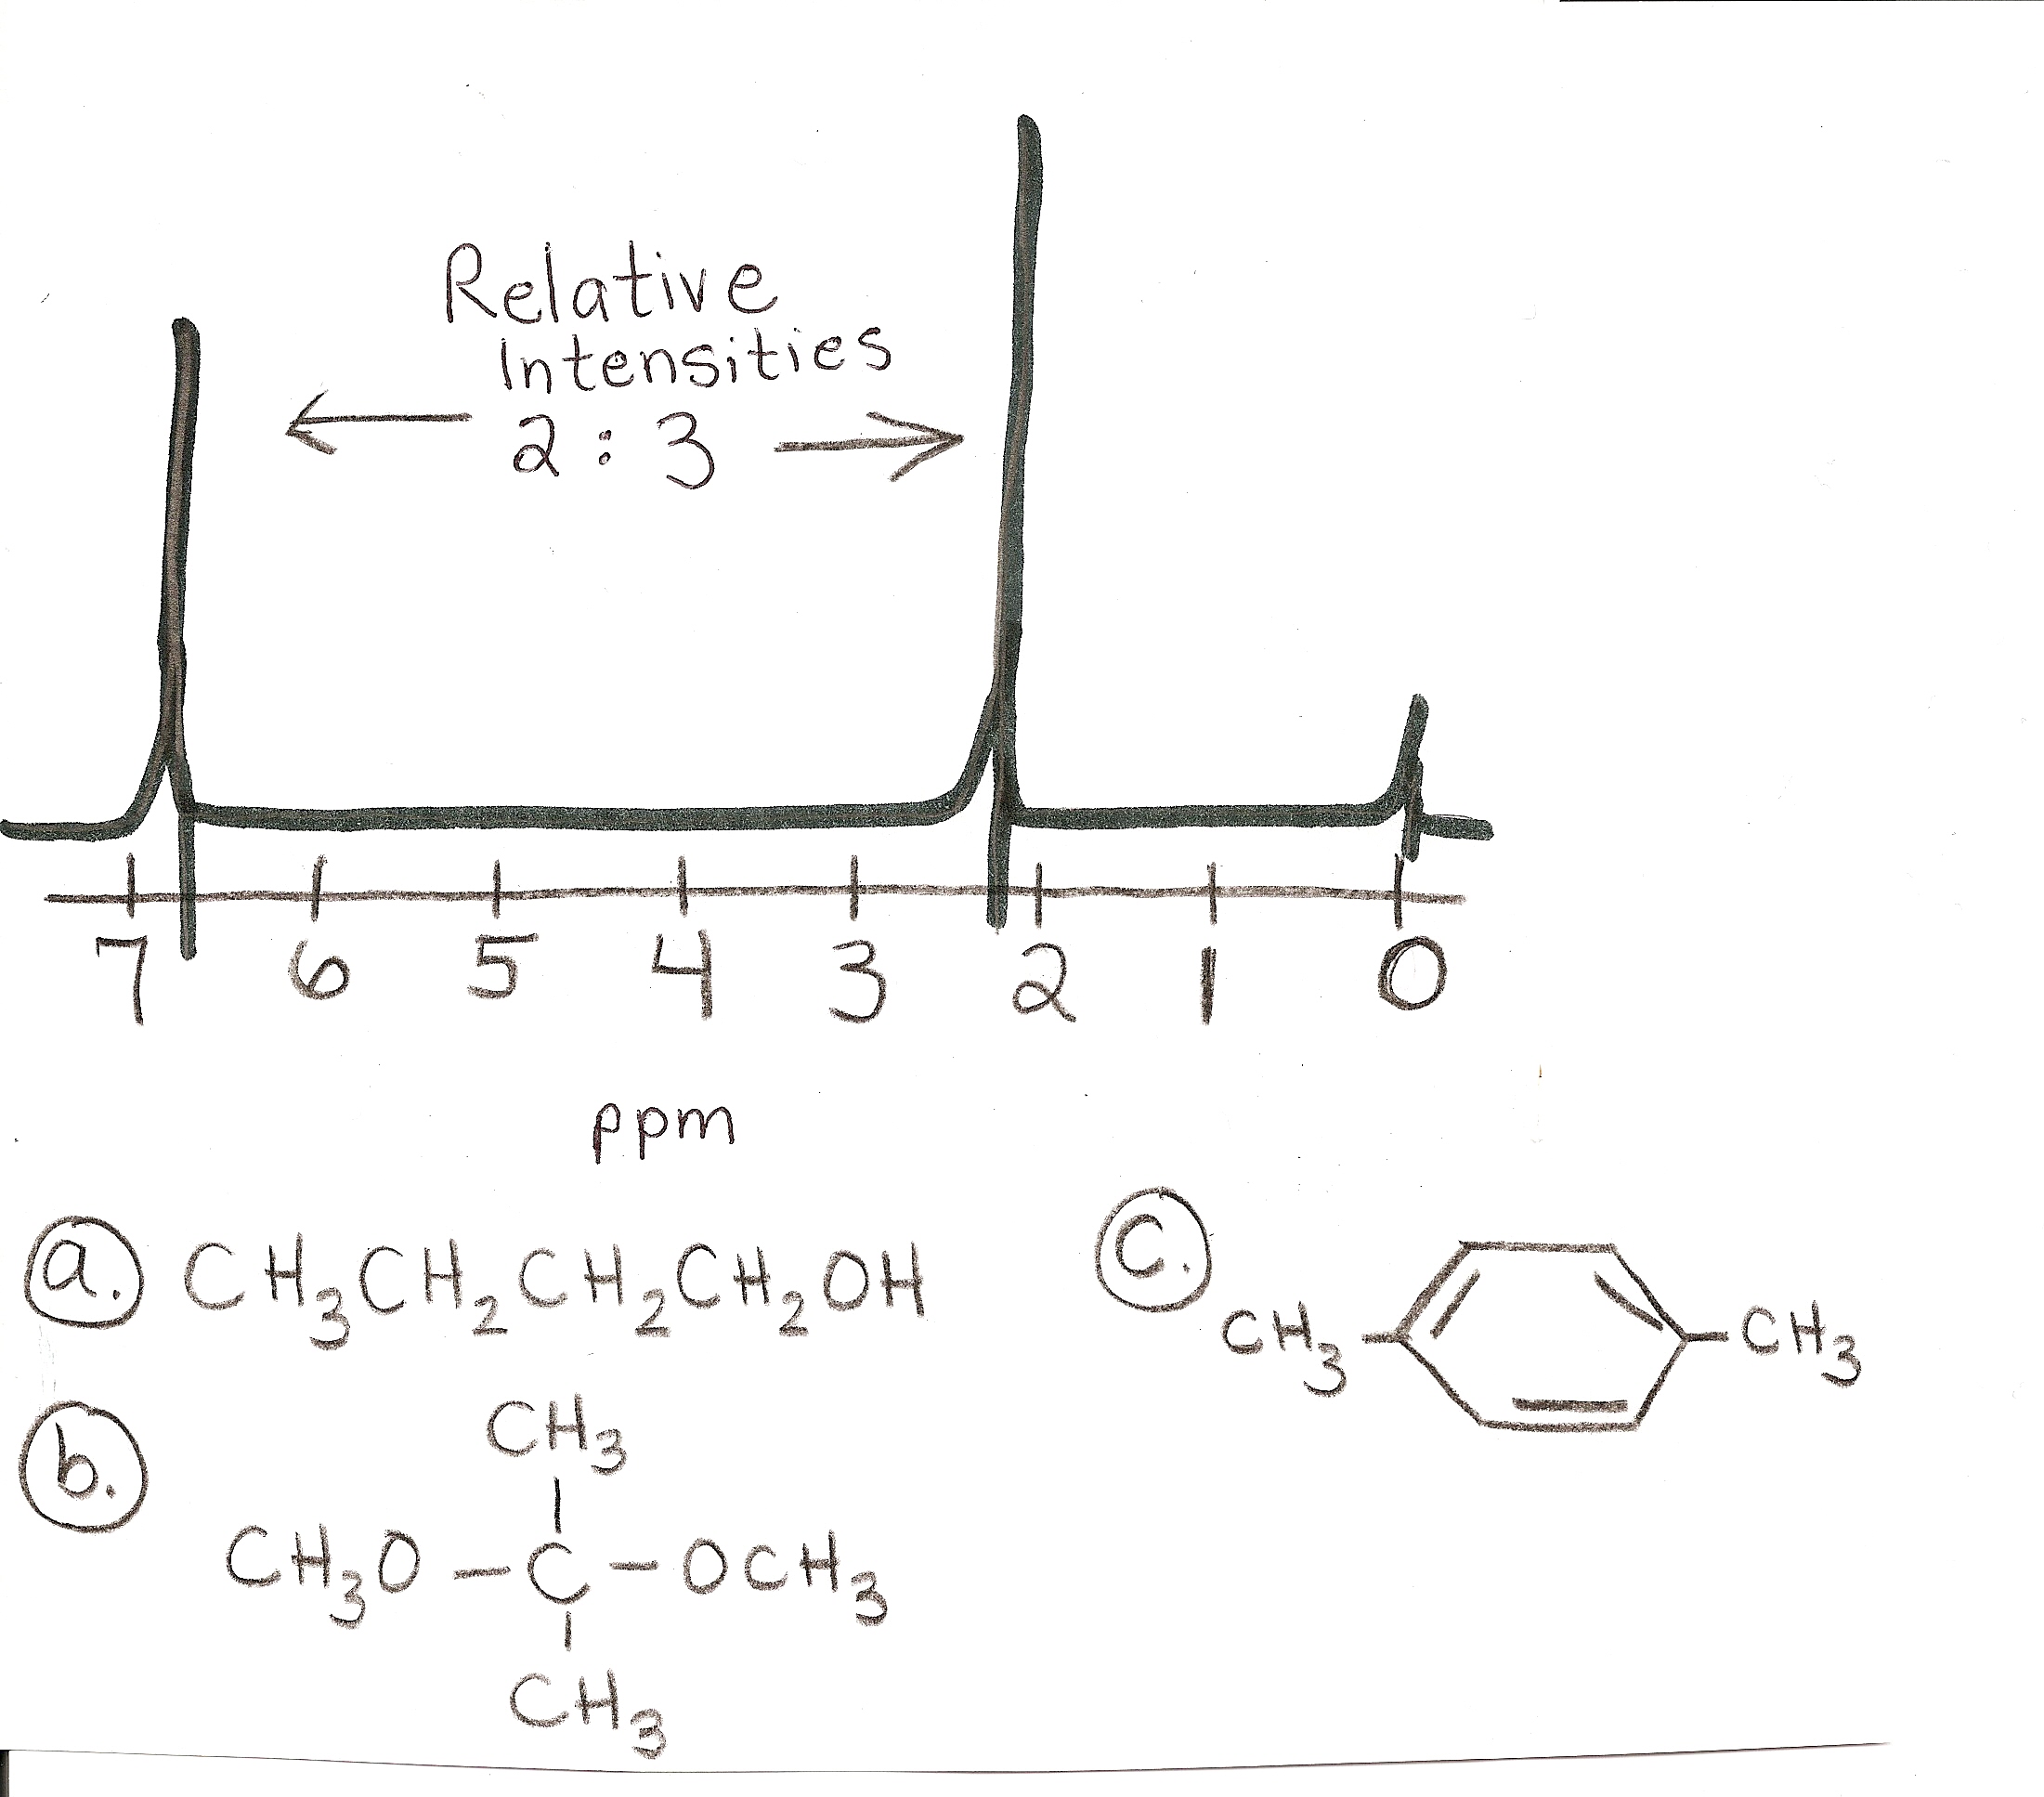
answer is c
Answers
- False. The relative number of hydrogens determines the intensity of a signal. The signal given by the three hydrogens in CH3CH2CHCl2 will not have the same intensity as the three hydrogens in ClCH2OCH3.
- There are 2 signals. One is at 3.3 ppm (6 hydrogens); the other at 3.5 ppm (4 hydrogens).
- a and d
- c


 .
. .
.
 .
. .
. .
. .
. .
.
 .
. .
.


 10000 devout Hindus were present for the Hindu Dharmajagruti Sabha at Amalner, Maharashtra