


1H-1H COSY (COrrelated SpectroscopY) is a useful method for determining which signals arise from neighboring protons (usually up to four bonds). Correlations appear when there is spin-spin coupling between protons, but where there is no coupling, no correlation is expected to appear.
This method is very useful when the multiplets overlap or when is extensive second order coupling complicates the 1D spectrum.
There are many variants on the COSY pulse sequence. The most popular one in our laboratory is the gradient enhanced double quantum coherence (DQF-COSY) version. The ratio of gradient strengths is usually set to two to yield all COSY signals but may be set to three to yield only those correlations involving three protons, e.g., CH-CH2. We use the gradient enhanced DQF-COSY pulse sequence shown in fig. 1.
Fig. 1. Pulse sequence for gradient DQF-COSY

The COSY spectrum as shown in fig. 2 for ethylbenzene (fig. 3) contains a diagonal and cross peaks (signals that are not on the diagonal and correspond to other signals on the same horizontal and vertical projections). The cross peaks indicate couplings between two mutliplets up to three, or occasionally four, bonds away. The diagonal consists of the 1D spectrum with single peaks suppressed.
The most apparent cross-peak in the spectrum is between H1′ and H2′ at 2.65 and 1.24 ppm. A much weaker four-bond correlation (see the figure below) appears between H1′ and H2 at 2.65 and 7.20 ppm. All the desired signals are antiphase. Half the multiplet is positive and half negative. In addition, artifacts (undesired signals) appear in the spectrum as vertical streaks (interference and f1 noise) and along the inverted ‘V’ (fig. 4) whose tip is on the top axis of the sepctrum. These artifacts are rarely in phase with the desired signals and appear in specific locations.
Fig. 2. 2D COSY spectrum of ethylbenzene
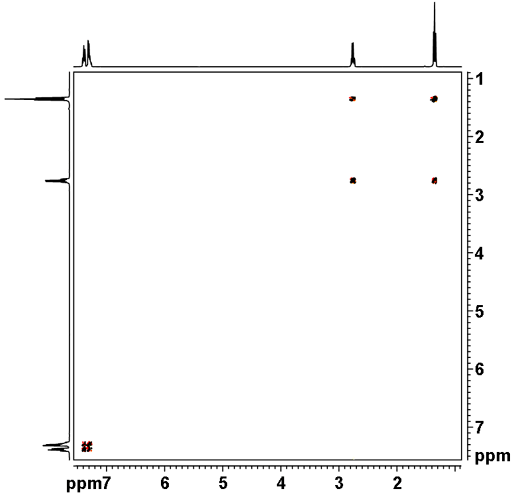
Fig. 3. Structure of ethylbenzene
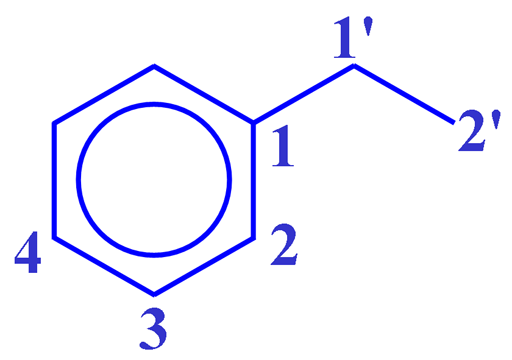
Fig. 4. Artifacts in the COSY spectrum of ethylbenzene

For example, in 12,14-ditbutylbenzo[g]chrysene (fig. 5), only a partial analysis of the regular 1H-NMR spectrum is possible. COSY (fig. 6) provides extra information about the connectivity. No correlations (cross-peaks) are seen to the tbutyls because they are too many bonds away from the ring system.
Fig. 5. Structure of 12,14-ditbutylbenzo[g]chrysene
![12,14-ditbutylbenzo[g]chrysene](http://chem.ch.huji.ac.il/nmr/techniques/2d/cosy/cosy_files/dtbbgc.gif)
Fig. 6. Artifacts in the COSY spectrum of ethylbenzene
![COSY of 12,14-ditbutylbenzo[g]chrysene](http://chem.ch.huji.ac.il/nmr/techniques/2d/cosy/cosy_files/cosydtbbgc.gif)
The aromatic region of the spectrum (fig. 7) shows three bond correlations strongest. These can be used to determine which protons are neighbors. For example the proton at 8.17 ppm is next to the proton at 7.34 ppm, a fact that could not be easily determined from the 1D spectrum.
Fig. 7. Aromaric region of the 2D COSY spectrum of 12,14-ditbutylbenzo[g]chrysene showing mostly three-bond correlations (a four-bond correlation between H10 and H11 is also visible)
![Aromatic region of COSY of 12,14-ditbutylbenzo[g]chrysene](http://chem.ch.huji.ac.il/nmr/techniques/2d/cosy/cosy_files/aromaticdtbbgc.gif)
Four-bond and five-bond correlations are apparent when plotted to lower contours (fig. 8). These separate the spectrum into four groups of protons in a manner that is much clearer than the 1D spectrum.
Fig. 8. Aromaric region of the 2D COSY spectrum of 12,14-ditbutylbenzo[g]chrysene showing three, four and five-bond correlations
![Aromatic region of COSY of 12,14-ditbutylbenzo[g]chrysene](http://chem.ch.huji.ac.il/nmr/techniques/2d/cosy/cosy_files/aromaticdtbbgc2.gif)
Using horizontal and vertical lines, it is possible to separate each group and follow its connectivity (fig. 9). The blue group of four protons is connected in the order 8.62 ppm to 7.55 to 7.59 to 8.56, the green group of four protons in the order 8.54 to 7.34 to 7.44 to 8.17 and the red group or two protons, that correspond to H9 and 10 because they are the only group of two protons expected to have a three-bond coupling constant (8.9 Hz), are at 7.76 and 8.32 ppm. The yellow group of two protons correspond to H11 and 13 because the coupling constant is small (1.9 Hz) and consistent with a four bond correlation.
Fig. 9. Aromaric region of the 2D COSY spectrum of 12,14-ditbutylbenzo[g]chrysene showing connectivity and separation into four color-coded proton groups
![Aromatic region of COSY of 12,14-ditbutylbenzo[g]chrysene in color](http://chem.ch.huji.ac.il/nmr/techniques/2d/cosy/cosy_files/coloraromatic.gif)
The multiplet structures in COSY are anti-phase for active couplings which leads to different patterns that for pure phase. A pure singlet (A) will not appear in a DQF-COSY spectrum because it is purely single quantum and a double-quantum filter is applied. This is true for deuterated solvent signals and for some protiated solvents such as water. Advantage of this is often taken for solvent suppression. A simple doublet appears in anti-phase. Many other combinations exist. The more common ones are listed in the table below and a few examples are shown.
Table 1. multiplicities often seen in COSY spectra compared with their pure phase counterparts.a
| Multiplicity | Pure phase | Anti-phase |
|---|---|---|
| A | 1 | 0 |
| AX | 1 1 | 1 -1 |
| AX2 | 1 2 1 | 1 0 -1 |
| AXY | 1 1 1 1 | 1 1 -1 -1 |
| AYX | 1 1 1 1 | 1 -1 1 -1 |
| AX3 | 1 3 3 1 | 1 1 -1 -1 |
| AX2Y | 1 2 1 1 2 1 | 1 0 -1 1 0 -1 |
| AY2X | 1 2 1 1 2 1 | 1 2 1 -1 -2 -1 |
| AXY2 | 1 1 2 2 1 1 | 1 -1 2 -2 1 -1 |
| AYX2 | 1 1 2 2 1 1 | 1 -1 0 0 1 -1 |
| AYX2, JAY=2JAX | 1 2 2 2 1 | 1 0 0 0 -1 |
| AXYZ | 1 1 1 1 1 1 1 1 | 1 1 1 1 -1 -1 -1 -1 |
| AYXZ | 1 1 1 1 1 1 1 1 | 1 1 -1 -1 1 1 -1 -1 |
| AYZX | 1 1 1 1 1 1 1 1 | 1 -1 1 -1 1 -1 1 -1 |
| AXYZ, JAX=JAY+JAZ | 1 1 1 2 1 1 1 | 1 1 1 0 -1 -1 -1 |
| AXYZ, JAY=JAX+JAZ | 1 1 1 2 1 1 1 | 1 1 -1 0 1 -1 -1 |
| AXYZ, JAZ=JAX+JAY | 1 1 1 2 1 1 1 | 1 -1 1 0 -1 1 -1 |
| AX6 | 1 6 15 20 15 6 1 | 1 2 1 0 -1 -2 -1 |
aThe active coupling is from A to X. The coupling constant decreases from left to right, e.g., for AXYZ, JAX > JAY > JAZ.
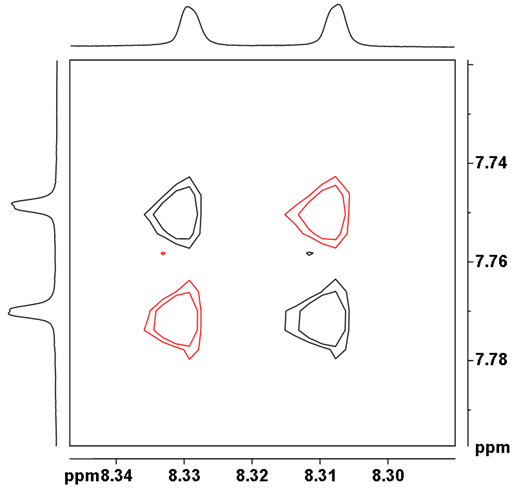
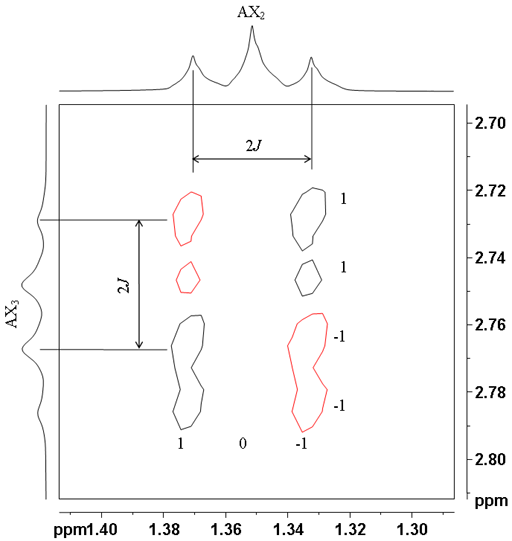
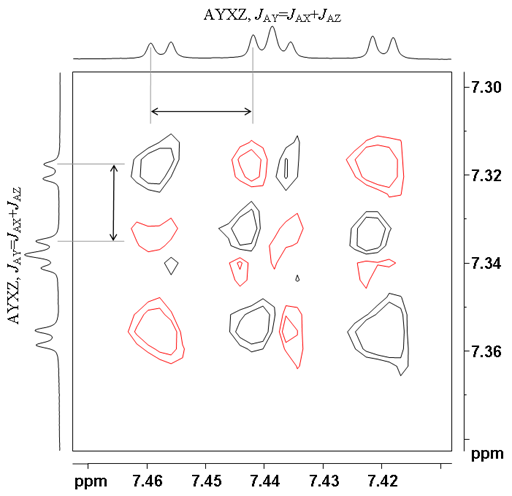
Figs. 10-13 show expansions of COSY multiplets. The red contours are negative and the black ones are positive. The 1D projections are only representations (in practice the sum of the projection is zero).
Fig. 10. Anti-phase AX correlation between doublets H9 and 10 of 12,14-ditbutylbenzo[g]chrysene
Higher multiplicities in which all the couplings are active yield the patterns shown in table 1. For example the correlation between the CH3 and CH2 protons in ethylbenzene yield a 1 0 1 pattern in one direction and a 1 1 -1 – 1 pattern in the other direction (fig. 11).
Fig. 11. Anti-phase A2X3 correlation between the ethyl protons of ethylbenzene
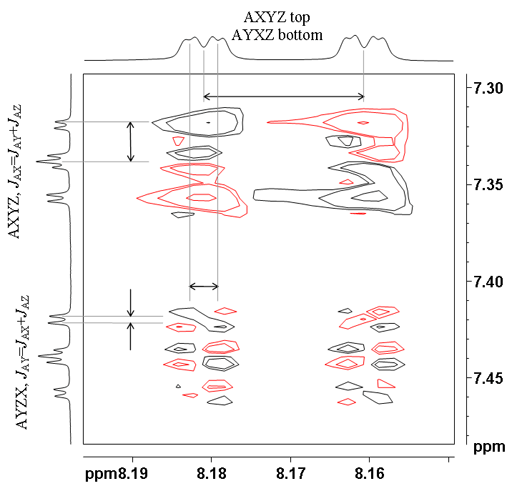
When there are more than two multiplets coupled, then only one coupling is active in each cross-peak. This can be used to determine which coupling constant relates to which correlation, something that may not be obvious from the 1D spectrum. In figs. 12 and 13 for ditbutylbenzo[g]chrysene, the active couplings are labeled. The top cross-peak between the protons at 7.34 and 8.17 ppm shows the largest active coupling of 8.1 Hz. The coupling pattern in the vertical (f1) direction is 1 1 1 0 -1 -1 -1 and in the horizontal (f2) direction it is 1 1 1 1 -1 -1 -1 -1. The multiplet below it has the smallest active coupling of 1.4 Hz. The f1 coupling pattern is 1 -1 1 0 -1 1 -1 and the f2 coupling pattern is 1 1 -1 -1 1 1 -1 -1. The bottom multiplet displays an active coupling of 7.0 Hz and the coupling pattern in both directions is 1 1 -1 0 1 -1 -1.
Figs. 12, 13. Comparison of three AXYZ correlations showing different active couplings (from the COSY of 12,14-ditbutylbenzo[g]chrysene)
EXAMPLE
COSY spectra
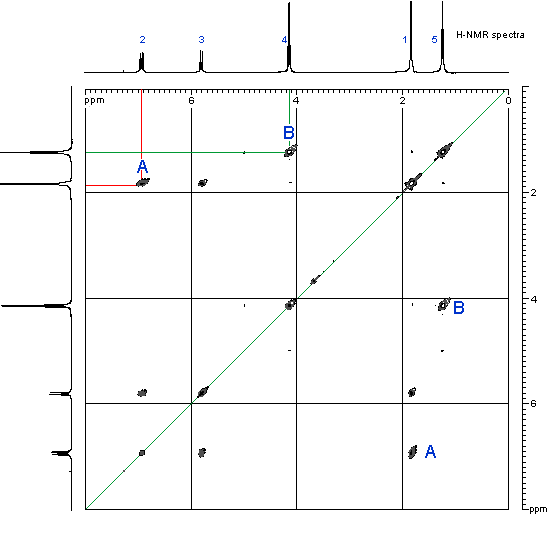
- The information on the H that are coupling with each other is obtained by looking at the peaks inside the grid. These peaks are usually shown in a contour type format, like height intervals on a map.
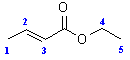
- In order to see where this information comes from, let’s consider an example shown below, the COSY of ethyl 2-butenoate
- First look at the peak marked A in the top left corner. This peak indicates a coupling interaction between the H at 6.9 ppm and the H at 1.8 ppm. This corresponds to the coupling of the CH3 group and the adjacent H on the alkene.
- Similarly, the peak marked B indicates a coupling interaction between the H at 4.15 ppm and the H at 1.25 ppm. This corresponds to the coupling of the CH2 and the CH3 in the ethyl group.
- Notice that there are a second set of equivalent peaks, also marked A and Bon the other side of the diagonal.
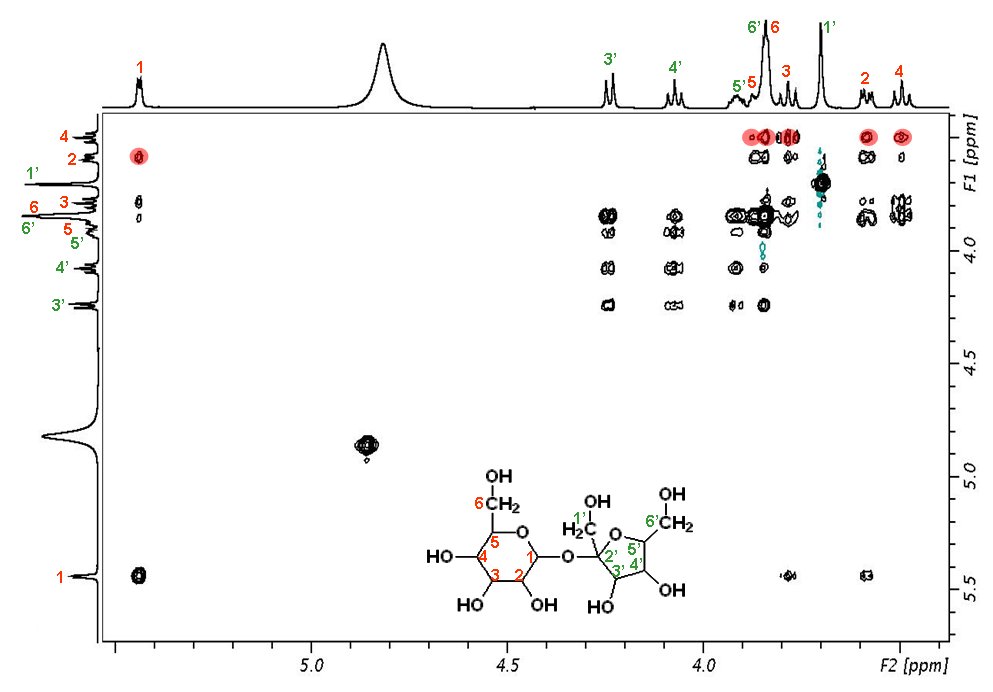
The (H,H) COSY experiment establishes the connectivity of a molecule by giving cross peaks (these are the off diagnonal peaks) for pairs of protons that are in close proximity. For the example of Glutamic acid below, we obtain cross peaks for the proton pairs (2,3) and (3,4). We do not observe a crosspeak for the pair (2,4), because these protons are not directly adjacent.
A relayed COSY experiment goes one step beyond a COSY experiment by showing cross peaks not just for pairs of adjacent protons, but for triples as well. As a result, we observe additional cross peaks like the one for the pair 2,4 in Glutamic acid below. Relayed COSY experiments can give cross peaks for protons that are too distant to show coupling in the 1D NMR spectrum.500 MHz H-relayed (H,H) COSY Spectrum of Glutamic acid. 1-D spectra left and top. 10 mg of compound in 0.5 mL of D2O, 5 mm sample tube, 256 spectra, digital resolution of 2.639 Hz/data point. Total measurement time ca. 3h.
500 MHz H-relayed (H,H) COSY Spectrum of Glutamic acid. 1-D spectra left and top. 10 mg of compound in 0.5 mL of D2O, 5 mm sample tube, 256 spectra, digital resolution of 2.639 Hz/data point. Total measurement time ca. 3h.
With present hardware and pulse sequences, it is possible to repeat the relay step up to three times. This allows the correlation of of protons that are separated by up to six bonds (d-protons). The relaying nucleus is typically 1H, but high abundance I =1/2 hetero-elements like 31P or 19F can be used as well.

3 Responses to “1H-1H COSY NMR”
Sorry, the comment form is closed at this time.
excellent
COSY is well explained and easy to understand. There are few spectroscopy books which have either only 1-2 pages for this topic or too much of algorithm making it complicated for analytical chemist.
very good to read and learn. Does it will help to define/identify the unknown impurity in any compound which is present in ppm level.